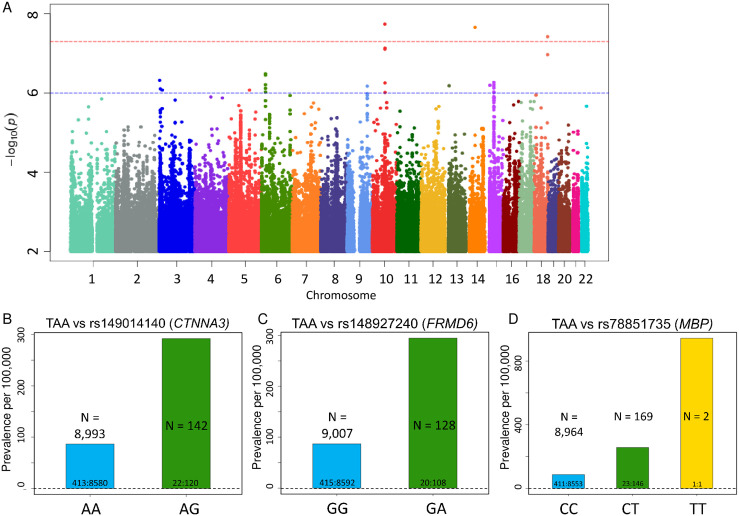
Fig 2. Top SNPs associated with TAA.
(A) Manhattan plot of GWAS results (MAF >0.5%) for TAA. (B-D) Prevalence of thoracic aortic aneurism (AAA) per 100,000 participants in the UK Biobank by genotype. Bars labeled with ratio of cases: Controls. (B) Prevalence of TAA increases with CTNNA3 variant rs149014140 status (P-value = 1.82x10⁻⁸, OR per G allele = 4.268). (C) Prevalence of TAA increases with FRMD6 variant rs148927240 status (P-value = 2.19x10⁻⁸, OR per A allele = 4.23). (D) Prevalence of TAA increases with MPB variant rs78851735 status (P-value = 3.79x10⁻⁸, OR per T allele = 3.446).

