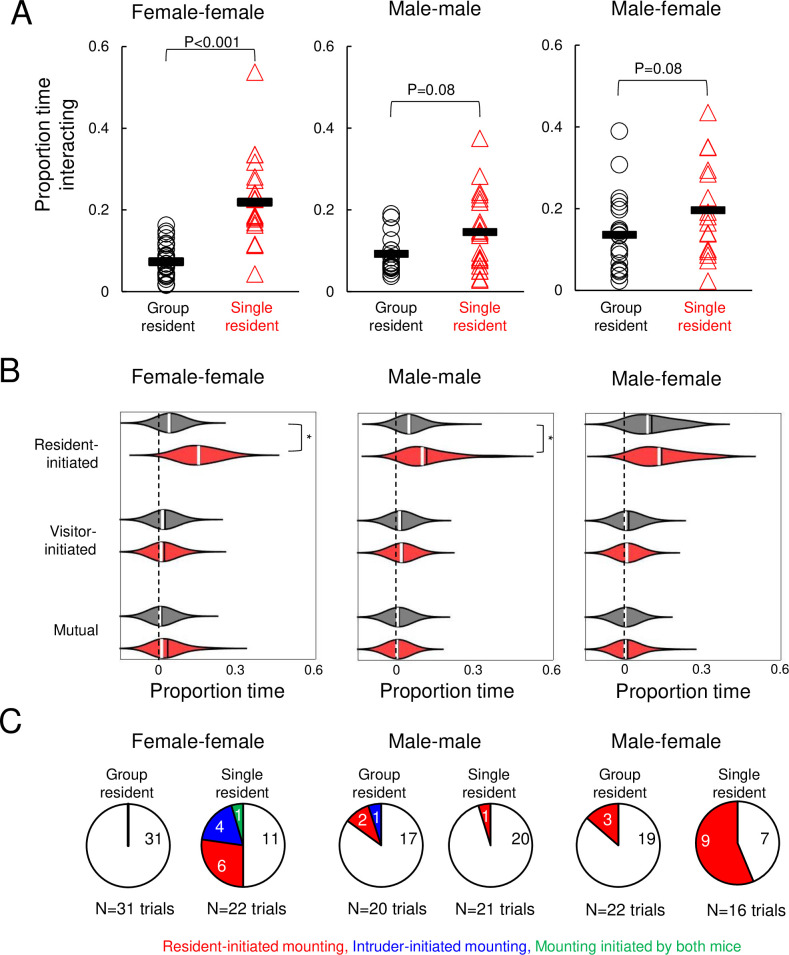
Fig 2. Effects of acute isolation on non-vocal social behaviors.
(A) Proportion time spent engaged in social interaction is shown for female-female trials (left), male-male trials (middle), and male-female trials (right). (B) Violin plots show the proportion time spent engaged in different non-vocal social behaviors for female-female trials (left), male-male trials (middle), and male-female trials (right). Gray, trials with group-housed residents; red, trials with single-housed residents. White lines indicate median values, black lines indicate mean values. Asterisks, p < 0.05. (C) Pie charts show the number of trials with mounting in female-female trials (left), male-male trials (middle), and male-female trials (right). White, no mounting; red, resident-initiated mounting; blue, visitor-initiated mounting; green, trials with both resident- and visitor-initiated mounting.

