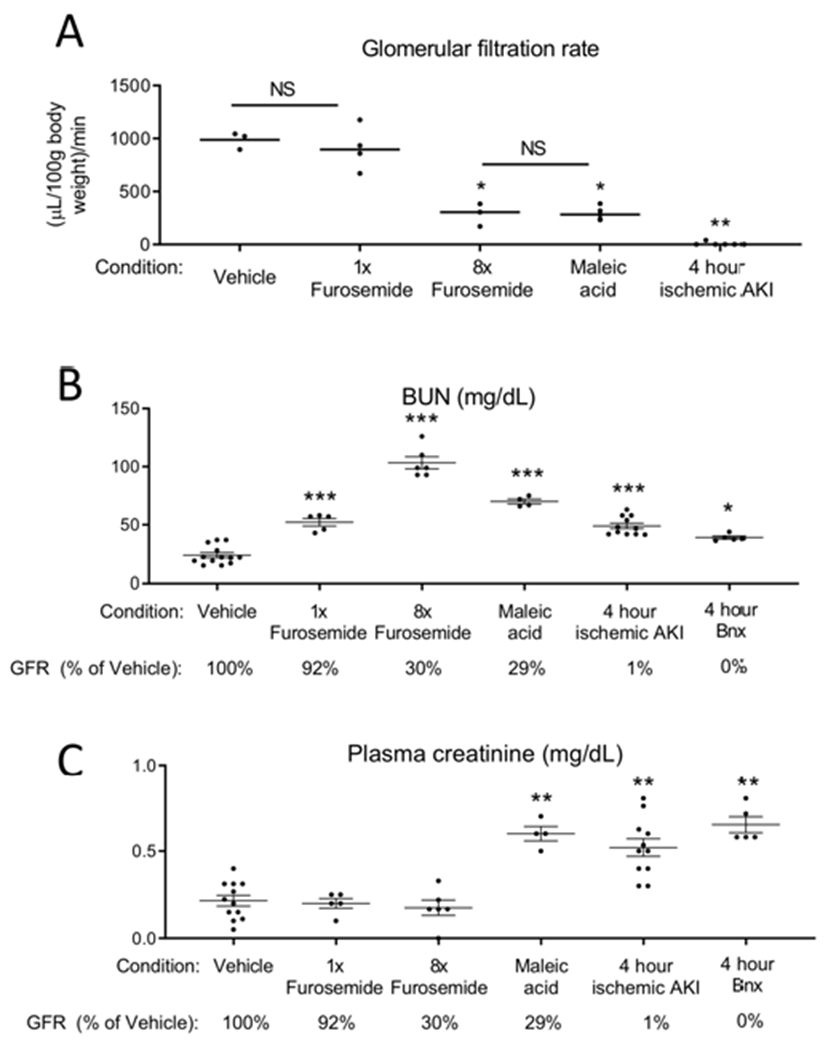
Figure 11. Models of AKI.

(A) Transcutaneous GFR was measured in 5 groups: 1) mice treated with vehicle (saline), 2) mice treated with 0.5 mg furosemide (1x furosemide) to induce mild prerenal azotemia, 3) mice treated with 4 mg furosemide for 2 doses (8x furosemide) to induce severe prerenal azotemia, 4) mice treated with maleic acid to induce proximal tubular injury and Fanconi syndrome, and 5) mice subjected to ischemic AKI. GFR was determined 6 hours after vehicle, furosemide, and maleic acid treatment, and 4 hours after ischemic AKI. GFR was analyzed by one way ANOVA, comparing all groups. *P < 0.01 versus Vehicle and 1x furosemide, **P < 0.001 versus all other groups. Results are expressed as mean ±SEM. n=3-6. (B) BUN and (C) plasma creatinine were determined 6 hours after vehicle, 6 hours after 1x furosemide, 6 hours after 8x furosemide, 6 hours after maleic acid, 4 hours after ischemic AKI, and 4 hours after bilateral nephrectomy. GFR as a percentage of vehicle treated is indicated for reference (GFR was not measured in the bilateral nephrectomy group, but is assumed to be “0” since both kidneys are removed). BUN and plasma creatinine were analyzed by t test versus vehicle: *P<0.05; **P<0.001, ***P<0.0001. Results are expressed as mean ±SEM. n=5-12 (groups include mice that directly had GFR measured, as well as additional mice).
