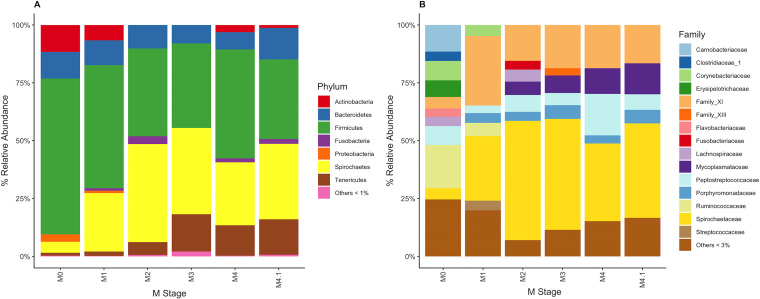
FIG 2.
Percent relative abundance of bacteria within each M stage. (A) Bacteria were grouped based on taxonomy at the phylum level, and phyla with a <1% relative abundance were grouped. (B) Bacteria were grouped based on taxonomy at the family level, and families with a <3% relative abundance were grouped.

