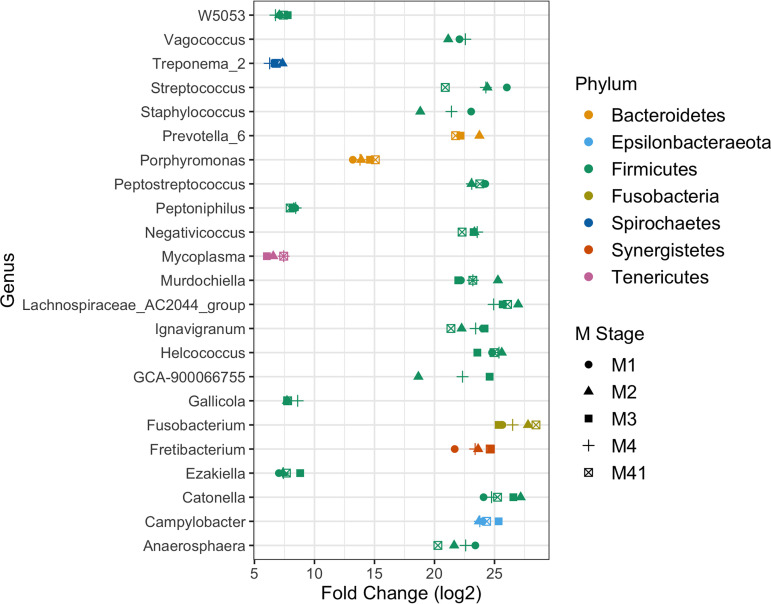
FIG 3.
Differential abundance analysis of genera associated with DD lesions. DESeq2-normalized sample counts were used to compare genus fold changes in abundance for DD M stages (M1, M2, M3, M4, and M4.1) against stage M0 (healthy) samples. Only genera that were statistically significant (P < 0.01) in at least three DD M stages compared to healthy skin are shown.

