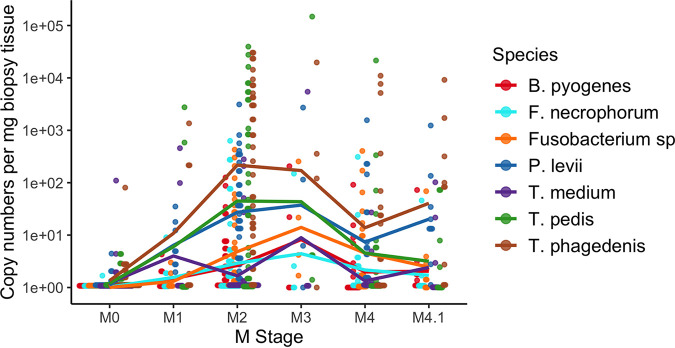
FIG 5.
Absolute abundance of each species across all M stages. Species copy numbers were standardized by the weight of the biopsy tissue. Each dot and color represent a different sample and a bacterial species, respectively. Lines are present for easy visual tracking of mean species copy numbers but do not represent a linear or continuous relationship between M stages.

