FIG 3.
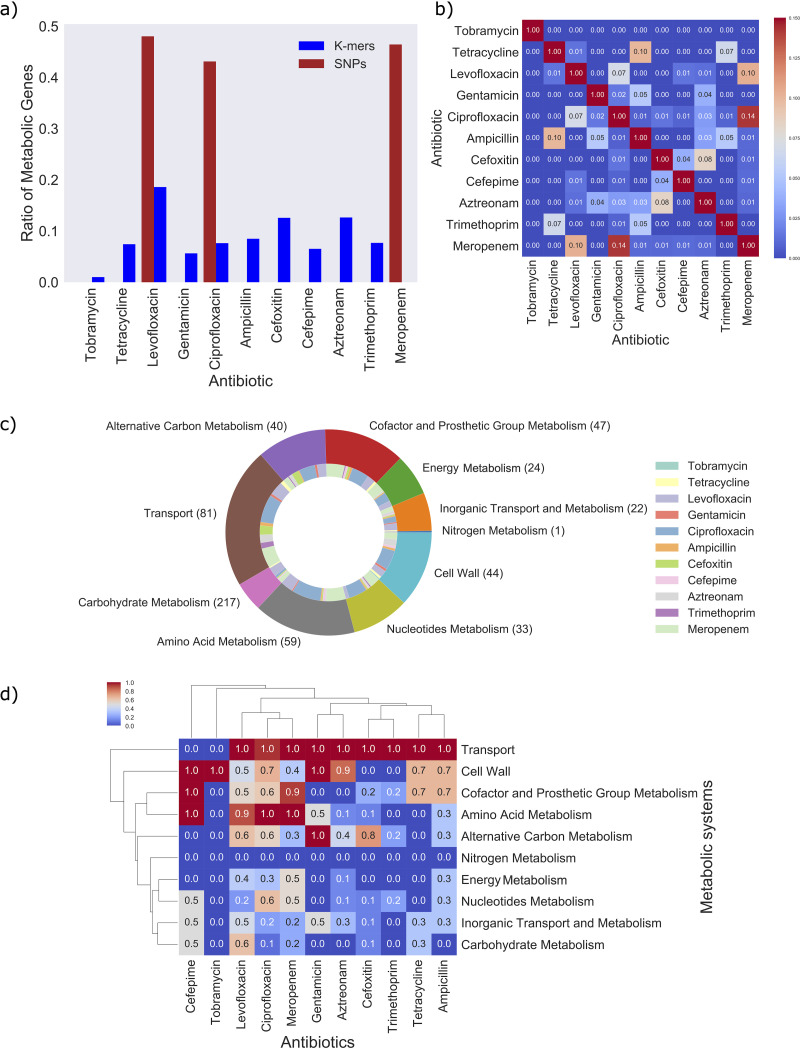
Number of metabolic genes occurring in the 11 AMR classifiers. (a) Bar chart showing proportions of metabolic genes compared to the entire set of genes found in each AMR model. The blue bars represent gene proportions from the k-mer AMR models, whereas the red bars represent gene proportions from the SNP AMR models (AUC > 95%). (b) Heatmap showing the Jaccard index comparing the gene sets between two antibiotic classes. (c) Pie chart showing the proportions of genes associated with 10 metabolic systems (outer ring presented using the “tab10” color theme in Matplotlib). The inner ring shows the proportion of genes from each antibiotic class associated with each metabolic system and is presented using the “Set3” color theme in Matplotlib. Note that genes contributing to multiple antibiotic classifications will contribute multiple times in the pie chart, and therefore, the total area of the pie chart does not amount to 289. (d) Heatmap showing the normalized number of genes associated with each metabolic system. Note that the number of genes was normalized via column standardization. Hierarchical clustering was applied to both rows (metabolic systems) and columns (antibiotic classes) using the single linkage method and Euclidean distance as the metric. Each panel shows the results for the top 10% of genes identified in each AMR classifier. Panels b, c, and d show the results for the 289 genes found by combining the genes that correspond to the features in the top 10% of the k-mer and SNP classifications.

