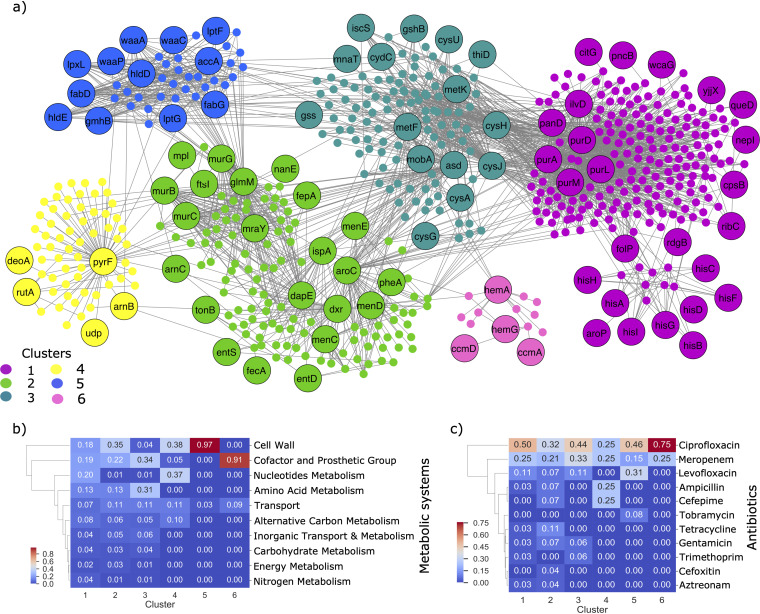
FIG 5.
Effects of genetic determinants on metabolite yields. (a) Bipartite network with genes and metabolites as nodes. Labeled nodes represent genes, whereas unlabeled nodes represent metabolites. A gene and metabolite are connected by an edge if the deletion of the gene blocks the metabolite production. Genes and metabolites are highlighted according to the cluster they were assigned to via the Networkx modularity algorithm. The number of clusters in the figure was reduced by considering only those of size greater than 10. (b) Heatmap showing the metabolic systems associated with each of the six clusters. A gene was associated with a metabolic system, if at least one metabolite correlated with the system could no longer be produced after the gene was deleted. (c) Heatmap showing the antibiotics associated with each cluster. Note that genes occurring in multiple antibiotics were accounted for twice. Hierarchical clustering was applied to the rows of each heatmap (metabolic systems or antibiotic class) using the single linkage method and Euclidean distance as the metric. The gene counts have been normalized by the total number of genes in each cluster in each heatmap.

