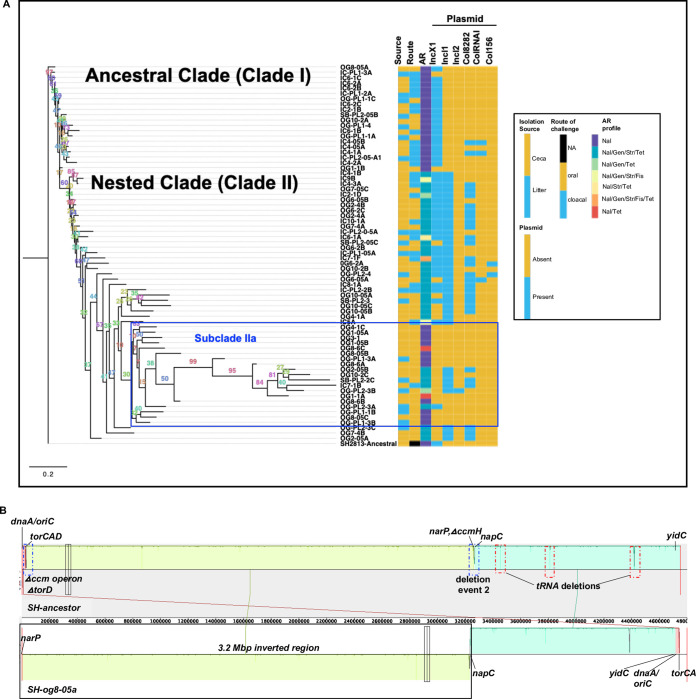
FIG 4.
HGT and chromosome inversion changed the genome of S. Heidelberg. (a) Maximum likelihood tree constructed using accessory genes present in S. Heidelberg isolates (n = 72) recovered from the ceca and litter of chicks colonized with S. Heidelberg. The GTR model of nucleotide substitution and the GAMMA model of rate heterogeneity were used for sequence evolution prediction. Numbers shown next to the branches represent the percentage of replicate trees where associated isolates cluster together based on ∼100 bootstrap replicates. All S. Heidelberg strains were assembled using Illumina short reads except OG8-05A, IC9B, and IC4-3A and SH2813-ancestral that were assembled using both Illumina short reads and PacBio or MinION long reads. The tree was rooted with the ancestral susceptible S. Heidelberg strain. Clade numbers were assigned arbitrarily to ease discussion on isolates that acquired antibiotic resistance. A blue rectangular box highlights the subclade with susceptible strains nested within antibiotic resistance strains due to misassembly bias. (Nal, nalidixic acid; Gen, gentamicin; Str, streptomycin; Tet, tetracycline; Fis, sulfisoxazole; NA, not applicable). (b) Mauve visualization of the inverted genome of S. Heidelberg strain og8-05a. The chromosomal contigs of og8-05a were aligned and ordered to the complete chromosome of the S. Heidelberg ancestor. A colored similarity plot is shown for each genome, of which the height is proportional to the level of sequence identity in that region. When the similarity plot points downward, it shows an alignment to the reverse strand of the S. Heidelberg ancestor genome, i.e., inversion. A segment highlighted with solid black rectangular box denotes the inverted region in og8-05a, while dashed blue and red rectangular boxes denote segments with mutations.

