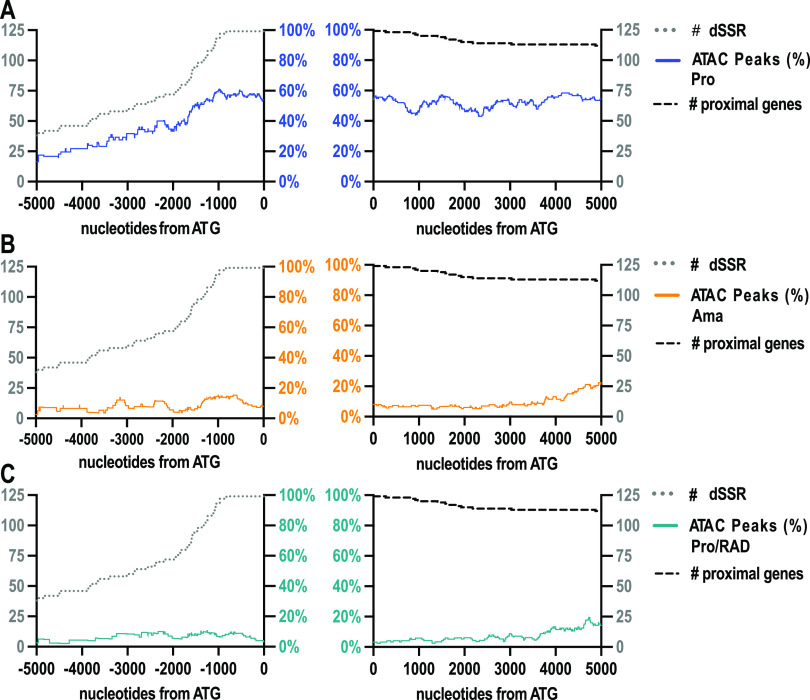
FIG 3.
ATAC peaks observed 5′ and 3′ from SSR-proximal CDS start sites. ATAC peak coverage in single-nucleotide resolution upstream (−5,000 bp to 1 bp) and downstream (+1 to +5,000 bp) of CDS start. Coverage is normalized to the number of analyzed divergent (d) SSRs and the number of proximal genes, respectively, for promastigotes (Pro, blue) (A), axenic amastigotes (Ama, orange) (B), and RAD-treated promastigotes (Pro/RAD, green) (C).

