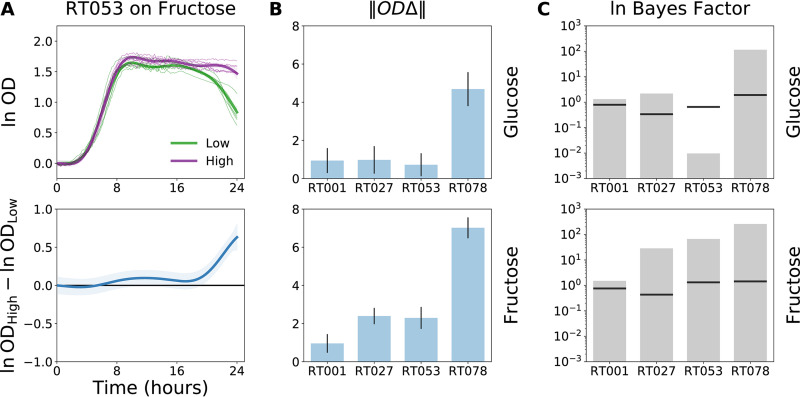
FIG 4.
Testing for differences in growth of each ribotype on low versus high concentrations of glucose or fructose. For each ribotype and sugar combination, we jointly modeled growth of microbial isolates on both low and high concentrations of each sugar. (A) Ribotype 053 C. difficile exhibited functional differences in growth on high versus low concentrations of fructose (ODΔ = ln ODHigh − ln ODLow) with small differences in OD during early stationary phase and much larger differences in OD after 18 h. (B) Functional differences between growth on low versus high concentration of each sugar for each ribotype are summarized with the sum of functional differences, , which quantifies the magnitude of differences between two curves. Error bars indicate 95% confidence intervals. (C) Log Bayes factor scores estimated how much the performance of these models improved by including the “concertation” covariate in addition to “time” in the models’ input. Black horizontal lines indicate the FDR of ≤10% threshold based on 100 model permutations. Actual log Bayes factor scores above these thresholds are considered significant.

