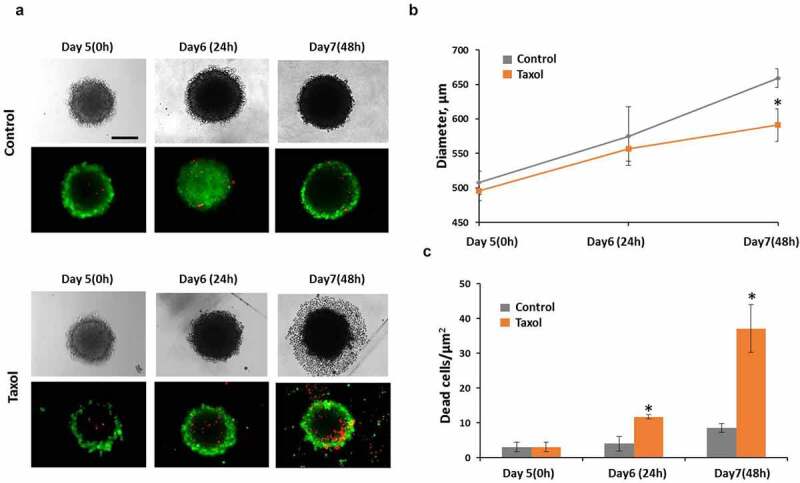
Figure 3.

Taxol influence on tumor spheroids. (a) representative image of spheroids in transmitted light and the corresponding fluorescence images of double live/dead staining with calcein (green color, live cells) and PI (red color, dead cells). (b) growth of spheroids under Taxol exposure (c) cell viability under Taxol exposure Bar is 200 µm * – statistically significant difference from control at the same time point
