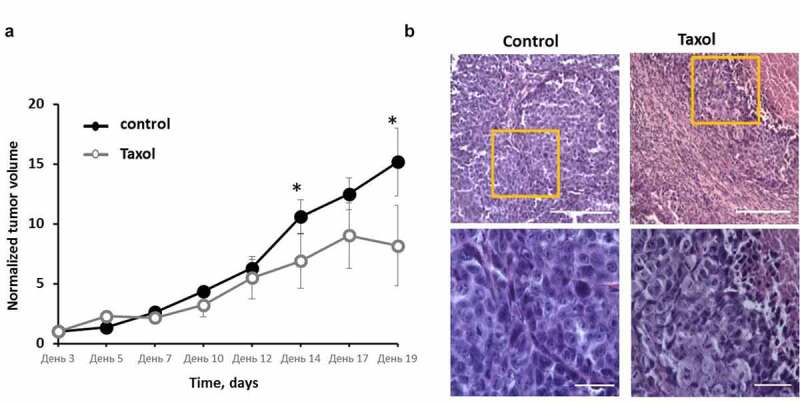
Figure 5.

Effects of Taxol on HeLa-SypHer2 tumors in mice. (a) Tumor volume dynamics in response to Taxol. Mice of the treated group (○) were administered i.p. with 10 mg/kg Taxol, starting from Day 3 (6 doses for 2 weeks in total). Control mice (●) received PBS on the same days. Mean ± SEM, n = 8 tumors. Tumor volumes from individual mice were normalized to the values measured on Day 3. *, statistically significant difference from control tumors, p ≤ 0.05. (b) Post-treatment histopathology of HeLa-SypHer2 tumors. H&E-staining. Enlarged regions are indicated by the yellow squares on the lower-magnification panel (210 × 280 μm, original magnification ×20). Higher-magnification images (60 × 80 μm, original magnification ×40) are shown on the lower panel. Bar is 100 μm for the lower panel and 200 μm for the upper panel
