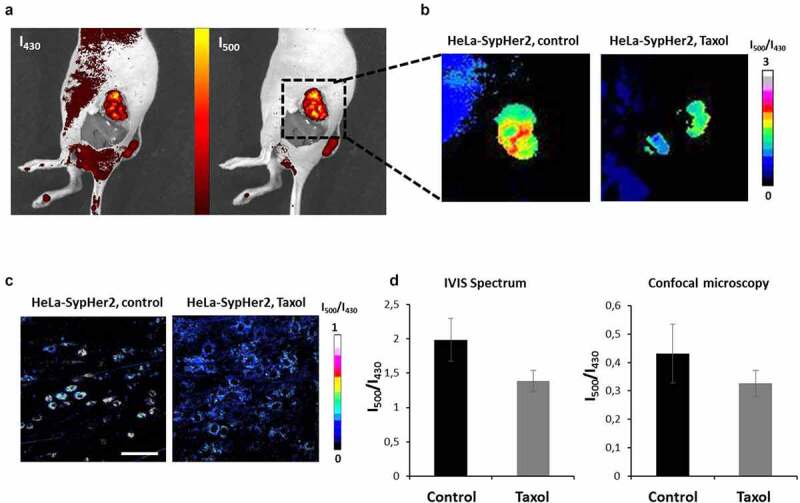
Figure 6.

In vivo pHi mapping in HeLa-SypHer2 tumors after treatment with Taxol. (a) Fluorescence images obtained with excitation at 430 nm and 500 nm (detection at 540 nm). (b) Representative images of SypHer2 ratio (I500/I430) in the control and treated tumors. (c) Representative microscopic images of SypHer2 ratio (I500/I430) from the control and treated tumors in vivo. Bar is 50 μm. (d) Quantitative analysis of the SypHer2 ratio in the tumors. Mean ± SEM, n = 3 tumors
