Figure 7.

CircSETD3 suppresses bladder cancer cell growth, migration, stemness through regulating miR-641/PTEN axis
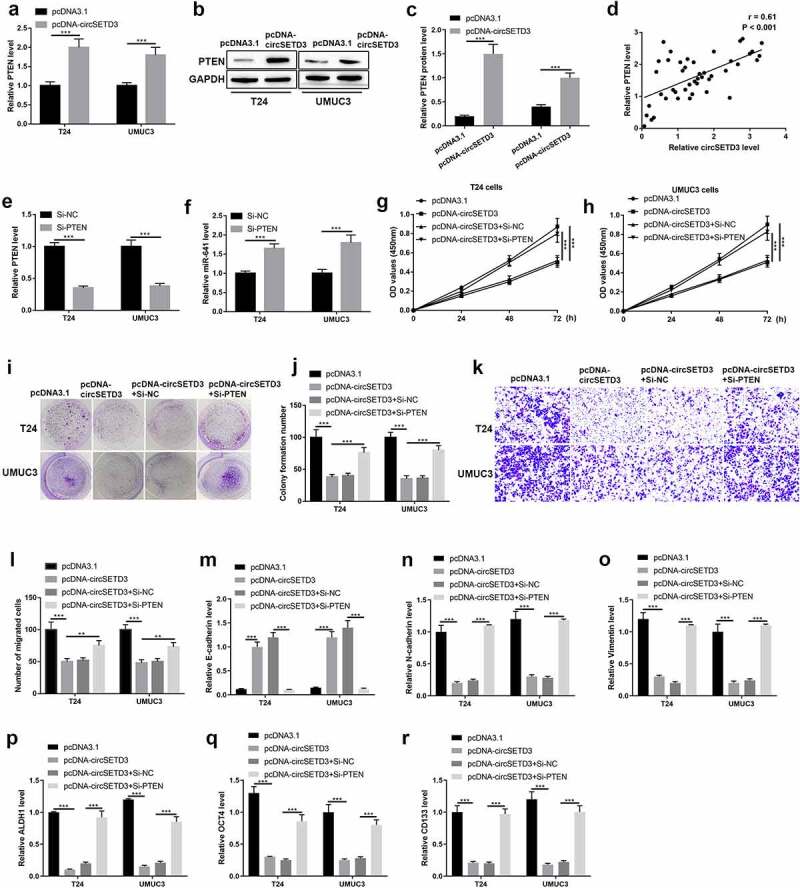
Upregulation of circSETD3, (a–c) MRNA and protein expression were measured by RT-qPCR and western blotting. (d) Correlation analysis between PTEN expression and circSETD3 expression in BLCA tissues was determined by Pearson correlation analysis. Knockdown of PTEN, (e and f) Expression of PTEN and miR-641 was analyzed by RT-qPCR. Upregulation of circSETD3 or knockdown of PTEN, g and h. Cell viability was determined using CCK-8 assay. (i and j) Cell colony formation was calculated by colony formation assay. k and l. Cell migration ability was analyzed by transwell assay. (m) The numbers of sphere were determined by microsphere formation assay. (n–p) Protein levels of E-cadherin, N-cadherin, and vimentin were detected by western blotting. q-s. Expression of ALDH1, OCT4, and CD133 was detected by RT-qPCR. **P < 0.01, ***P < 0.001.
