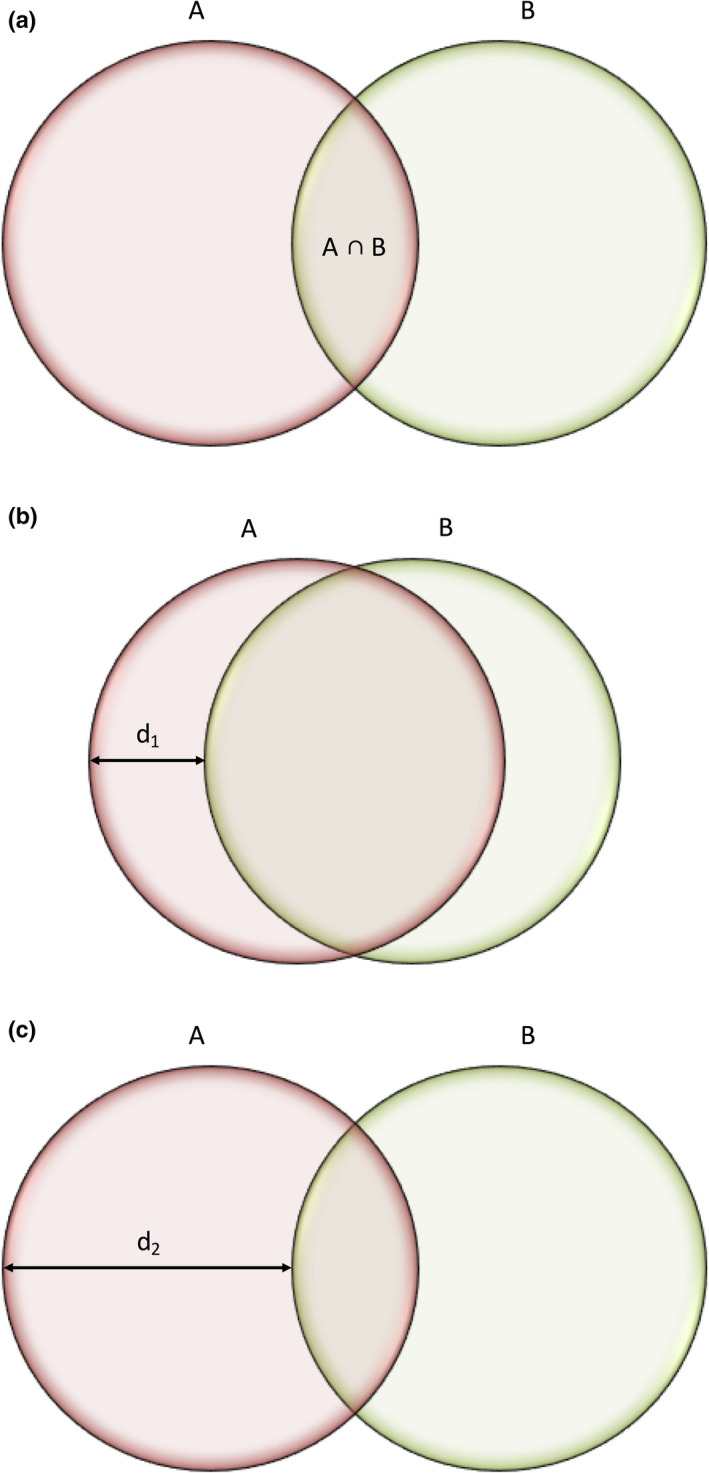
Figure 2.

Visualisation of Similarity Metrics. (a) The Dice Similarity Coefficient Represents an Index of Overlap (A ∩ B) Between Two Segmentations, Calculated as where 0 Represents No Overlap and 1 Perfect Alignment. (b) Two Segmentations A and B will have A Small Hausdorff Distance (d1) if the Segmentations are Close to Each Other. (c) Two Segmentations A and B will have a Large Hausdorff Distance (d2) if the Segmentations are Far from Each Other.
