Figure 4.

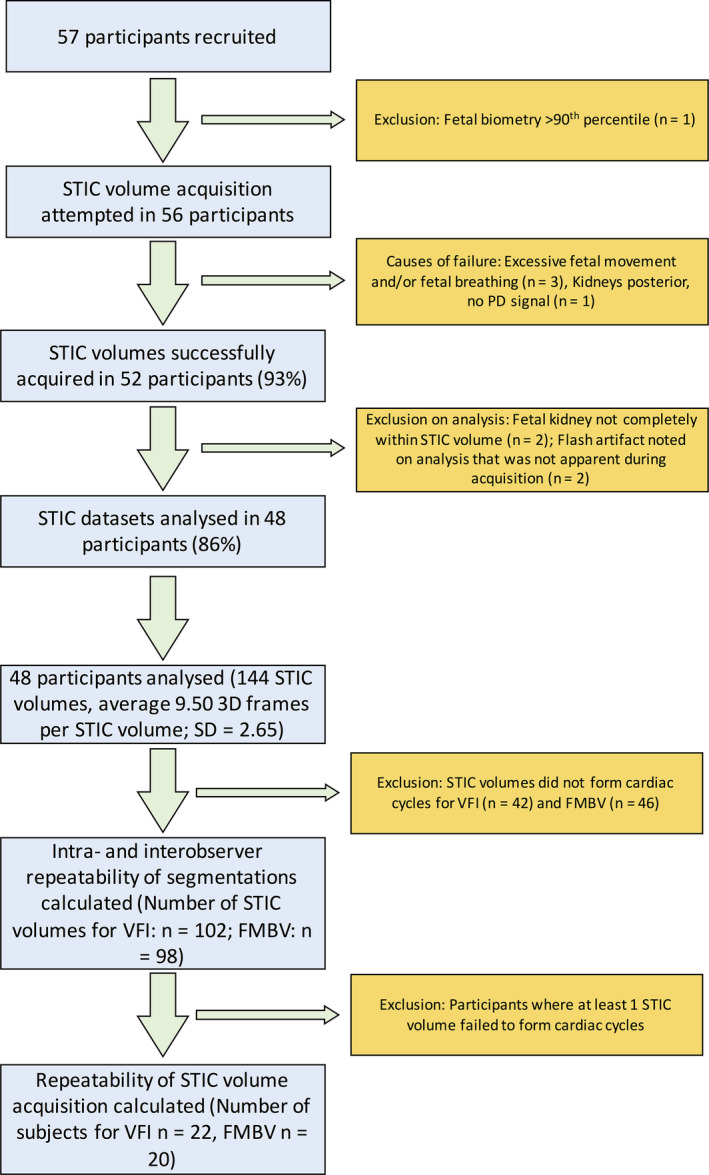
Flow Chart of Participant Inclusion and Exclusion. Spatial–Temporal Image Correlation Images were Acquired and Vascularity Measured Using Vascularisation‐Flow Index and Fractional Moving Blood Volume.

Flow Chart of Participant Inclusion and Exclusion. Spatial–Temporal Image Correlation Images were Acquired and Vascularity Measured Using Vascularisation‐Flow Index and Fractional Moving Blood Volume.