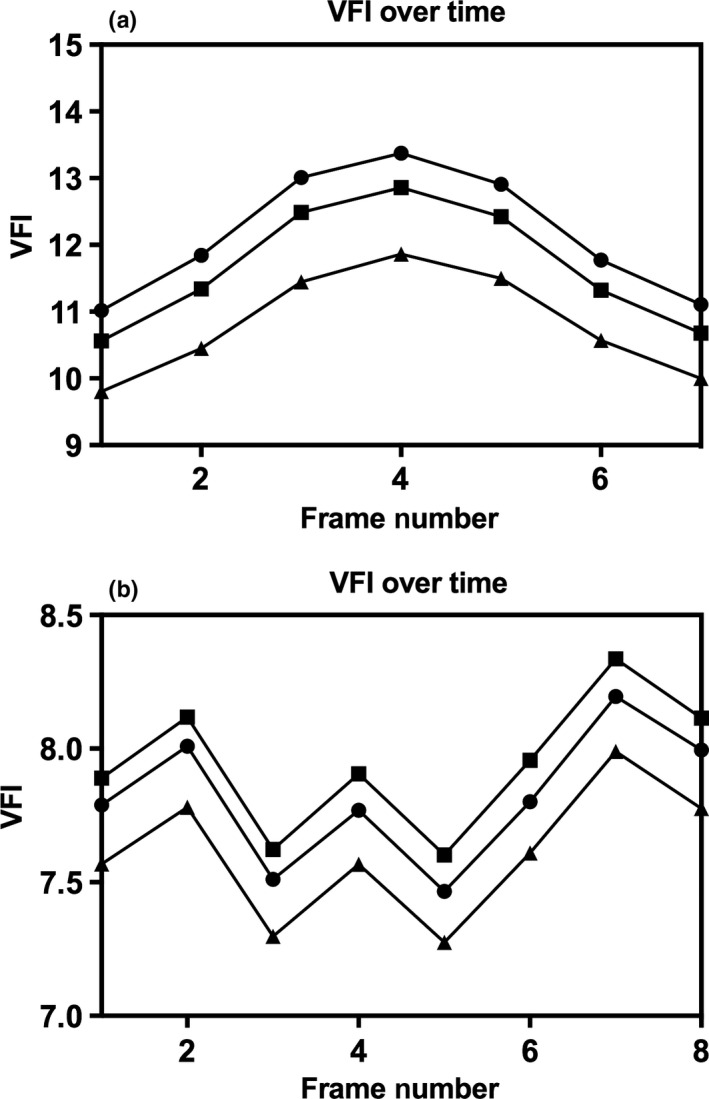
Figure 5.

Plots of Indices Over Frame Number Showing Successful (a) and Failed (b) Cardiac Cycle Reconstructions for Vascularisation‐Flow Index. The Three Lines Represent the Three Segmentations that were Defined for the Same Spatial–Temporal Image Correlation Volume.
