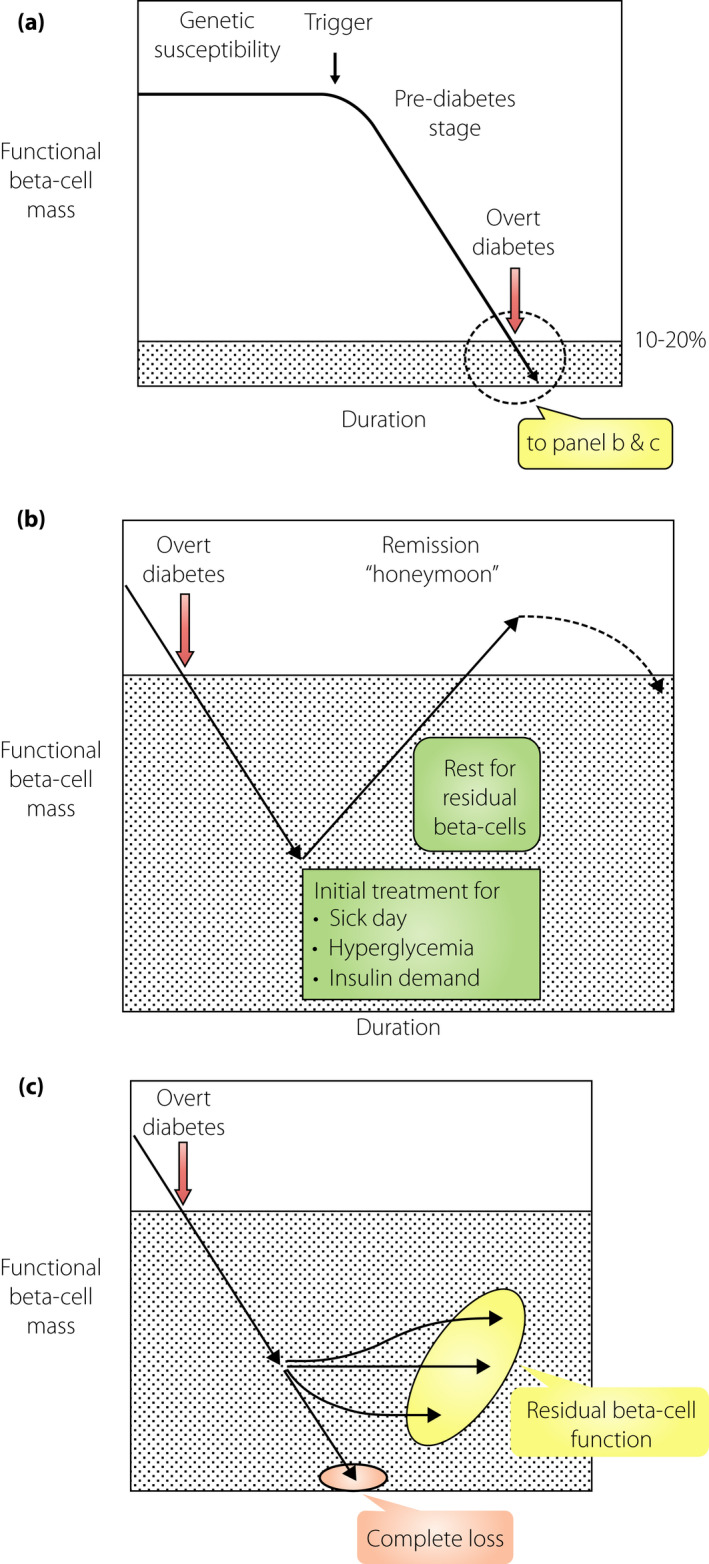
Figure 2.

Functional β‐cell mass before and after the onset of type 1 diabetes. The vertical axis represents the functional β‐cell mass, which denotes the sum of β‐cell mass and functional status of each β‐cell. The horizontal axis is the time taken for the onset of type 1 diabetes. (a) Progressive decrease in the functional β‐cell mass toward the onset of diabetes. The functional β‐cell mass progressively decreases as the onset of type 1 diabetes approaches, even if the glucose level is within the normal range (prediabetes stage). This decrease is not necessarily linear; rather, it fluctuates from time‐to‐time, depending on the situation. In the long term, however, this decrease is progressive toward diabetic onset. When the functional β‐cell mass reaches a critically low level, overt type 1 diabetes develops with acute‐onset ketosis or ketoacidosis. (b) Partial recovery in the functional β‐cell mass soon after diabetes onset (honeymoon period). The functional β‐cell mass partially recovers after initial treatment of sick‐day conditions and near normalization of hyperglycemia can be achieved by administering sufficient quantity of insulin. (c) The functional β‐cell mass in the long term after the onset of diabetes. Changes in the functional β‐cell mass after diabetes onset vary from patient to patient; for instance, the progressive decrease in β‐cell mass results in complete depletion of endogenous insulin in some cases. In other cases, the functional β‐cell mass is preserved, albeit a very small amount, even after a long duration. However, there might be cases with sustained remission, although not clearly evidenced, that keep the functional β‐cell mass and insulin secretory function above the insulin‐dependency level.
