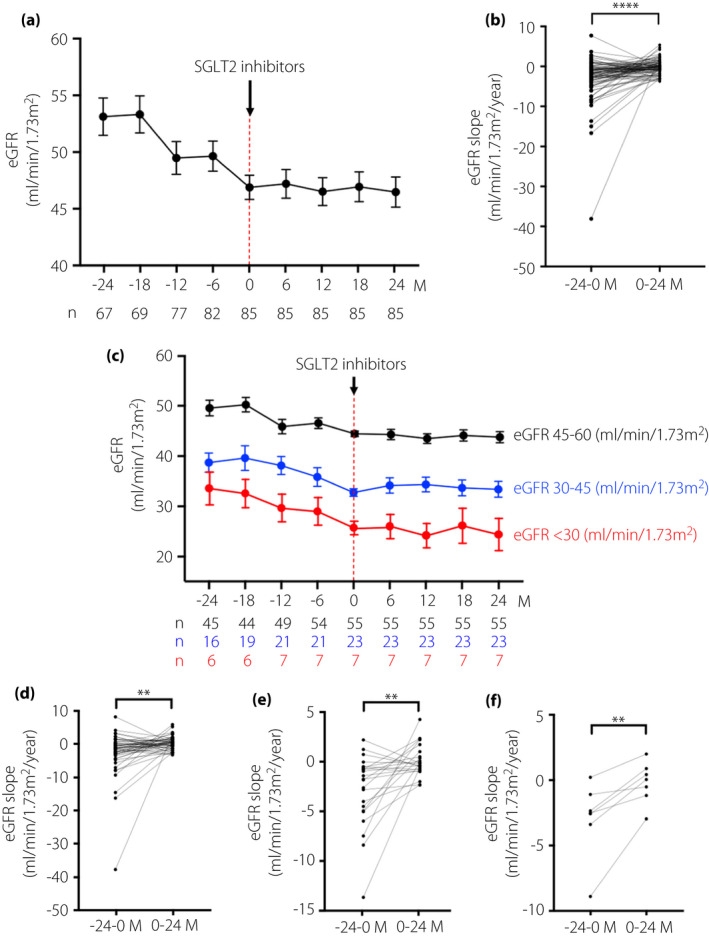
Figure 1.

Changes in the mean estimated glomerular filtration rate (eGFR) slope before and after administration of sodium–glucose cotransporter 2 inhibitors (SGLT2is). The mean eGFR over the time course before and after administration of SGLT2is in (a) all study participants with <60 mL/min/1.73 m2, (c) patients with eGFR 45–60 mL/min/1.73 m2, patients with eGFR 30–45 mL/min/1.73 m2 and patients with eGFR <30 mL/min/1.73 m2, at the start of SGLT2is administration, respectively. The number of patients who had eGFR data at the observational periods is shown in the lower panel of the graph of mean eGFR. Differences of changes in the mean eGFR slope before and after SGLT2is administrations in each of the patient’s eGFR level groups: (b) eGFR <60 mL/min/1.73 m2, (d) 45–60 mL/min/1.73 m2, (e) 30–45 mL/min/1.73 m2 and (f) <30 mL/min/1.73 m2 at the start of SGLT2is administration. Data are shown as the mean ± standard error (SE). ****P < 0.0001, ***P < 0.001, **P < 0.01, *P < 0.05; −24 to 0 months (M) vs 0–24 M.
