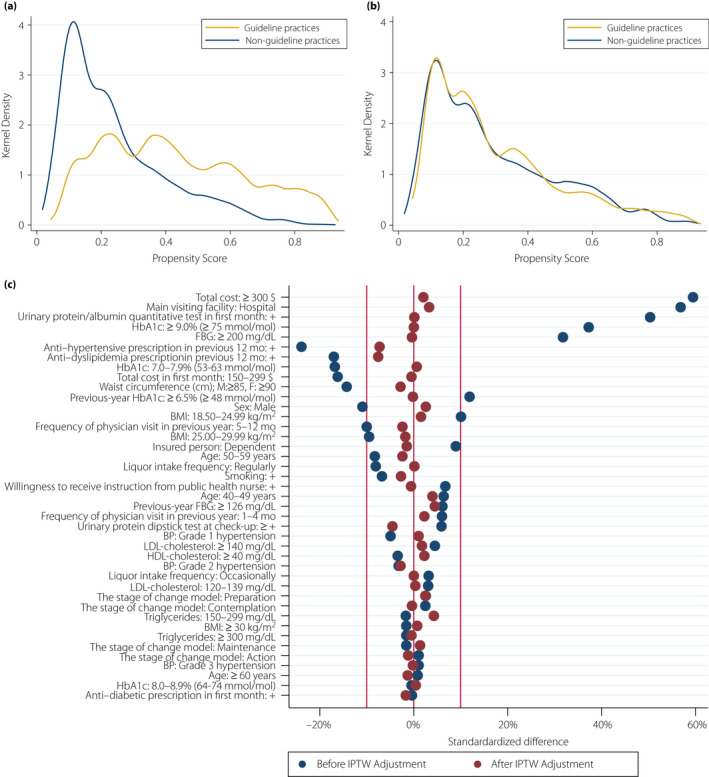
Figure 3.

Kernel density plots showing the distributions of propensity scores in patients who received guideline‐recommended practices and those who did not (a) before and (b) after inverse probability of treatment weighting. (c) The standardized differences were smaller after inverse probability of treatment weighting. (a,b) Guideline practices, those who received guideline‐recommended practices; non‐guideline practices, those who did not receive guideline‐recommended practices. BMI, body mass index; BP, blood pressure; FBG, fasting blood glucose; HbA1c, glycated hemoglobin; IPTW, inverse probability of treatment weighting; mo, months.
