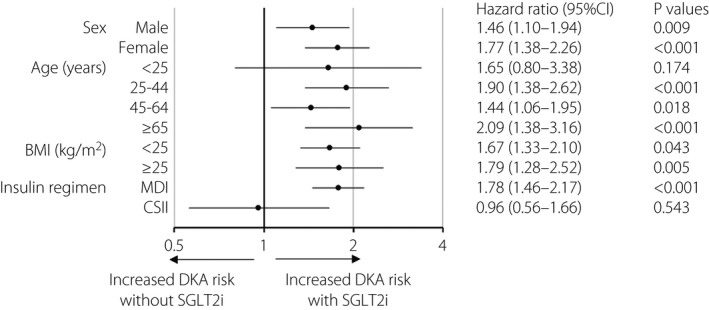
Figure 2.

Forest plot of the association between the onset of diabetic ketoacidosis (DKA) and use of sodium–glucose cotransporter 2 inhibitors (SGLT2is) in type 1 diabetes patients. Forest plot shows the hazard ratios (HRs) for DKA as per baseline clinical characteristics of type 1 diabetes patients receiving SGLT2is versus those not receiving SGLT2is. Circles represent the HR, and horizontal bars extend from the lower limit to the upper limit of the 95% confidence interval (CI) of the estimated HRs. BMI, body mass index; CSII, continuous subcutaneous insulin infusion; MDI, multiple daily injection.
