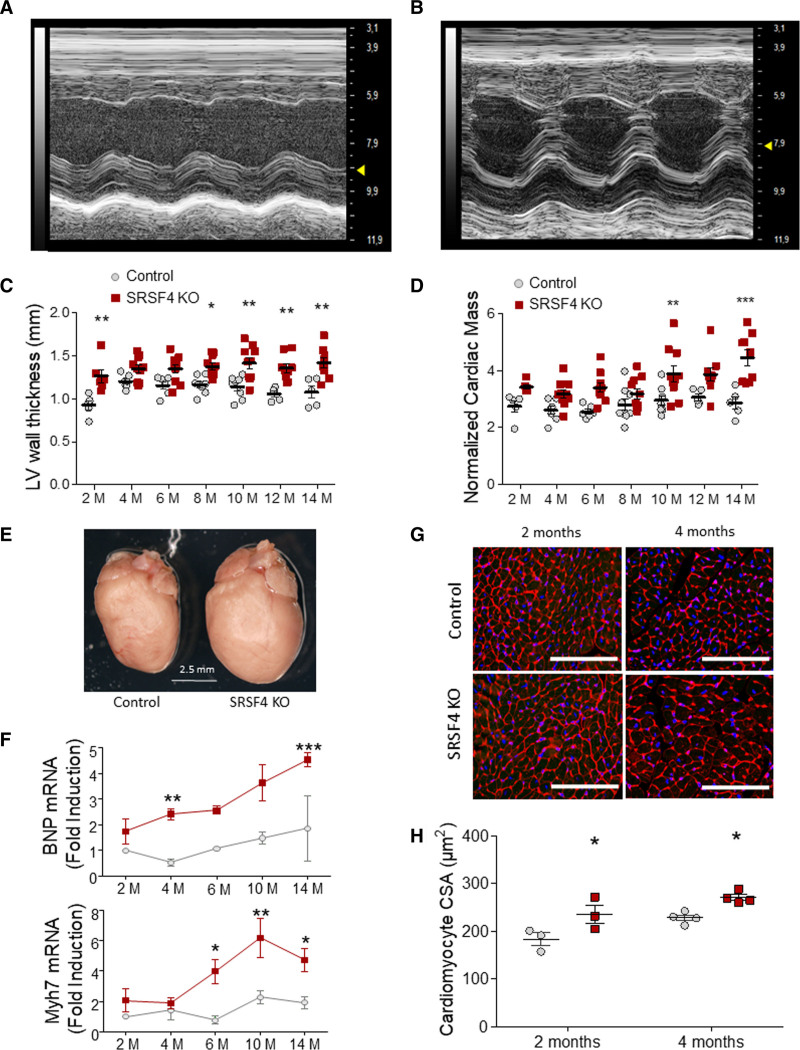
Figure 1.
Cardiac-specific loss of SRSF4 (serine/arginine splicing factor 4) leads to left ventricular (LV) hypertrophy.A and B, Representative M-mode short axis view echocardiography of control (A) and SRSF4 KO (B) left ventricles at 10 mo of age. C and D, Echocardiography analysis of LV wall thickness (C) and cardiac mass normalized to body weight (D). Data are shown as mean±SEM. Symbols represent individual animals (biological replicates). E, Representative whole hearts from 10-month-old control and KO mice. F, Quantitative real-time polymerase chain reaction analysis of brain natriuretic peptide (BNP) and Myh7 mRNA in control and SRSF4 KO hearts. n=4 mice per group in all groups except SRSF4 KO mice at 4 mol/L, which was n=5. C, D, and F, Data are shown as mean±SEM. *P<0.05, **P<0.01, ***P<0.001 for SRSF4 KO (red) vs control (gray). Two-way ANOVA followed by Bonferroni correction; M, months. G, Representative myocardial sections from 2- and 4-month-old mice, stained with tetramethylrhodamine-conjugated wheat-germ agglutinin (red) and DAPI (blue). Scale bar: 100 µm. H, Quantification of cardiomyocyte cross-sectional area (CSA). Each symbol represents the CSA average of one mouse. Data are shown as mean±SEM. *P<0.05 SRSF4 KO vs control. Two-way ANOVA followed by Bonferroni posttest. AW indicates anterior wall; and PW, posterior wall.

