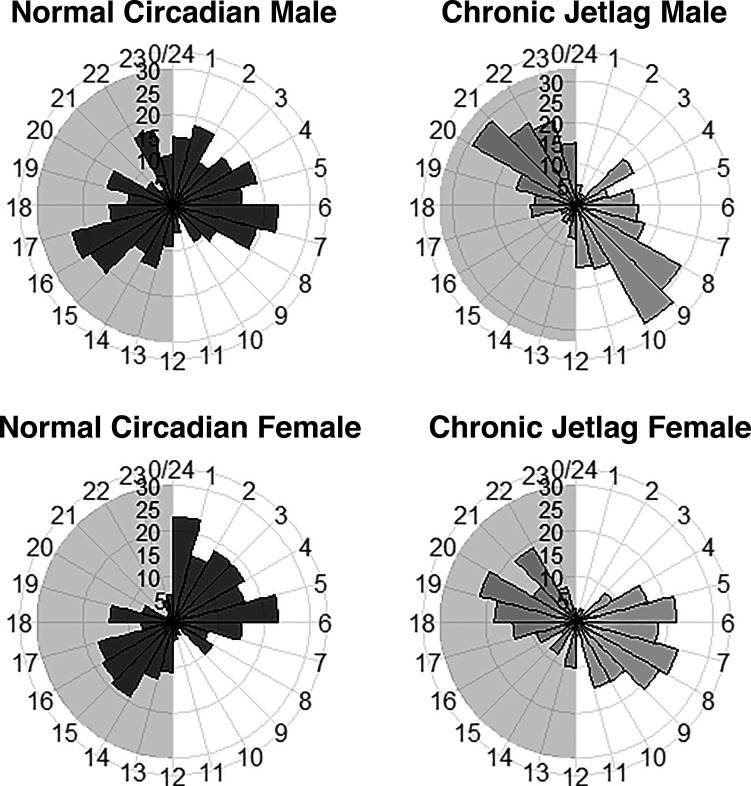
Figure 7.
Chronic jetlag promotes a phase shift in stably rhythmic genes. Histograms demonstrating the phase of peak expression are shown in 1-h bins. All stably rhythmic genes which exhibited a statistically significant phase shift on differential rhythmicity analysis were included. The scale originating from the center of each graph represents the number of genes at a particular zeitgeber time (ZT). The numbers along the periphery of each circle represent the ZT from ZT0-ZT24. Plot background shading represents the period of the night from ZT12-ZT24. Both male and female histograms demonstrate a bimodal curve that shifts in response to chronic jetlag conditions.

