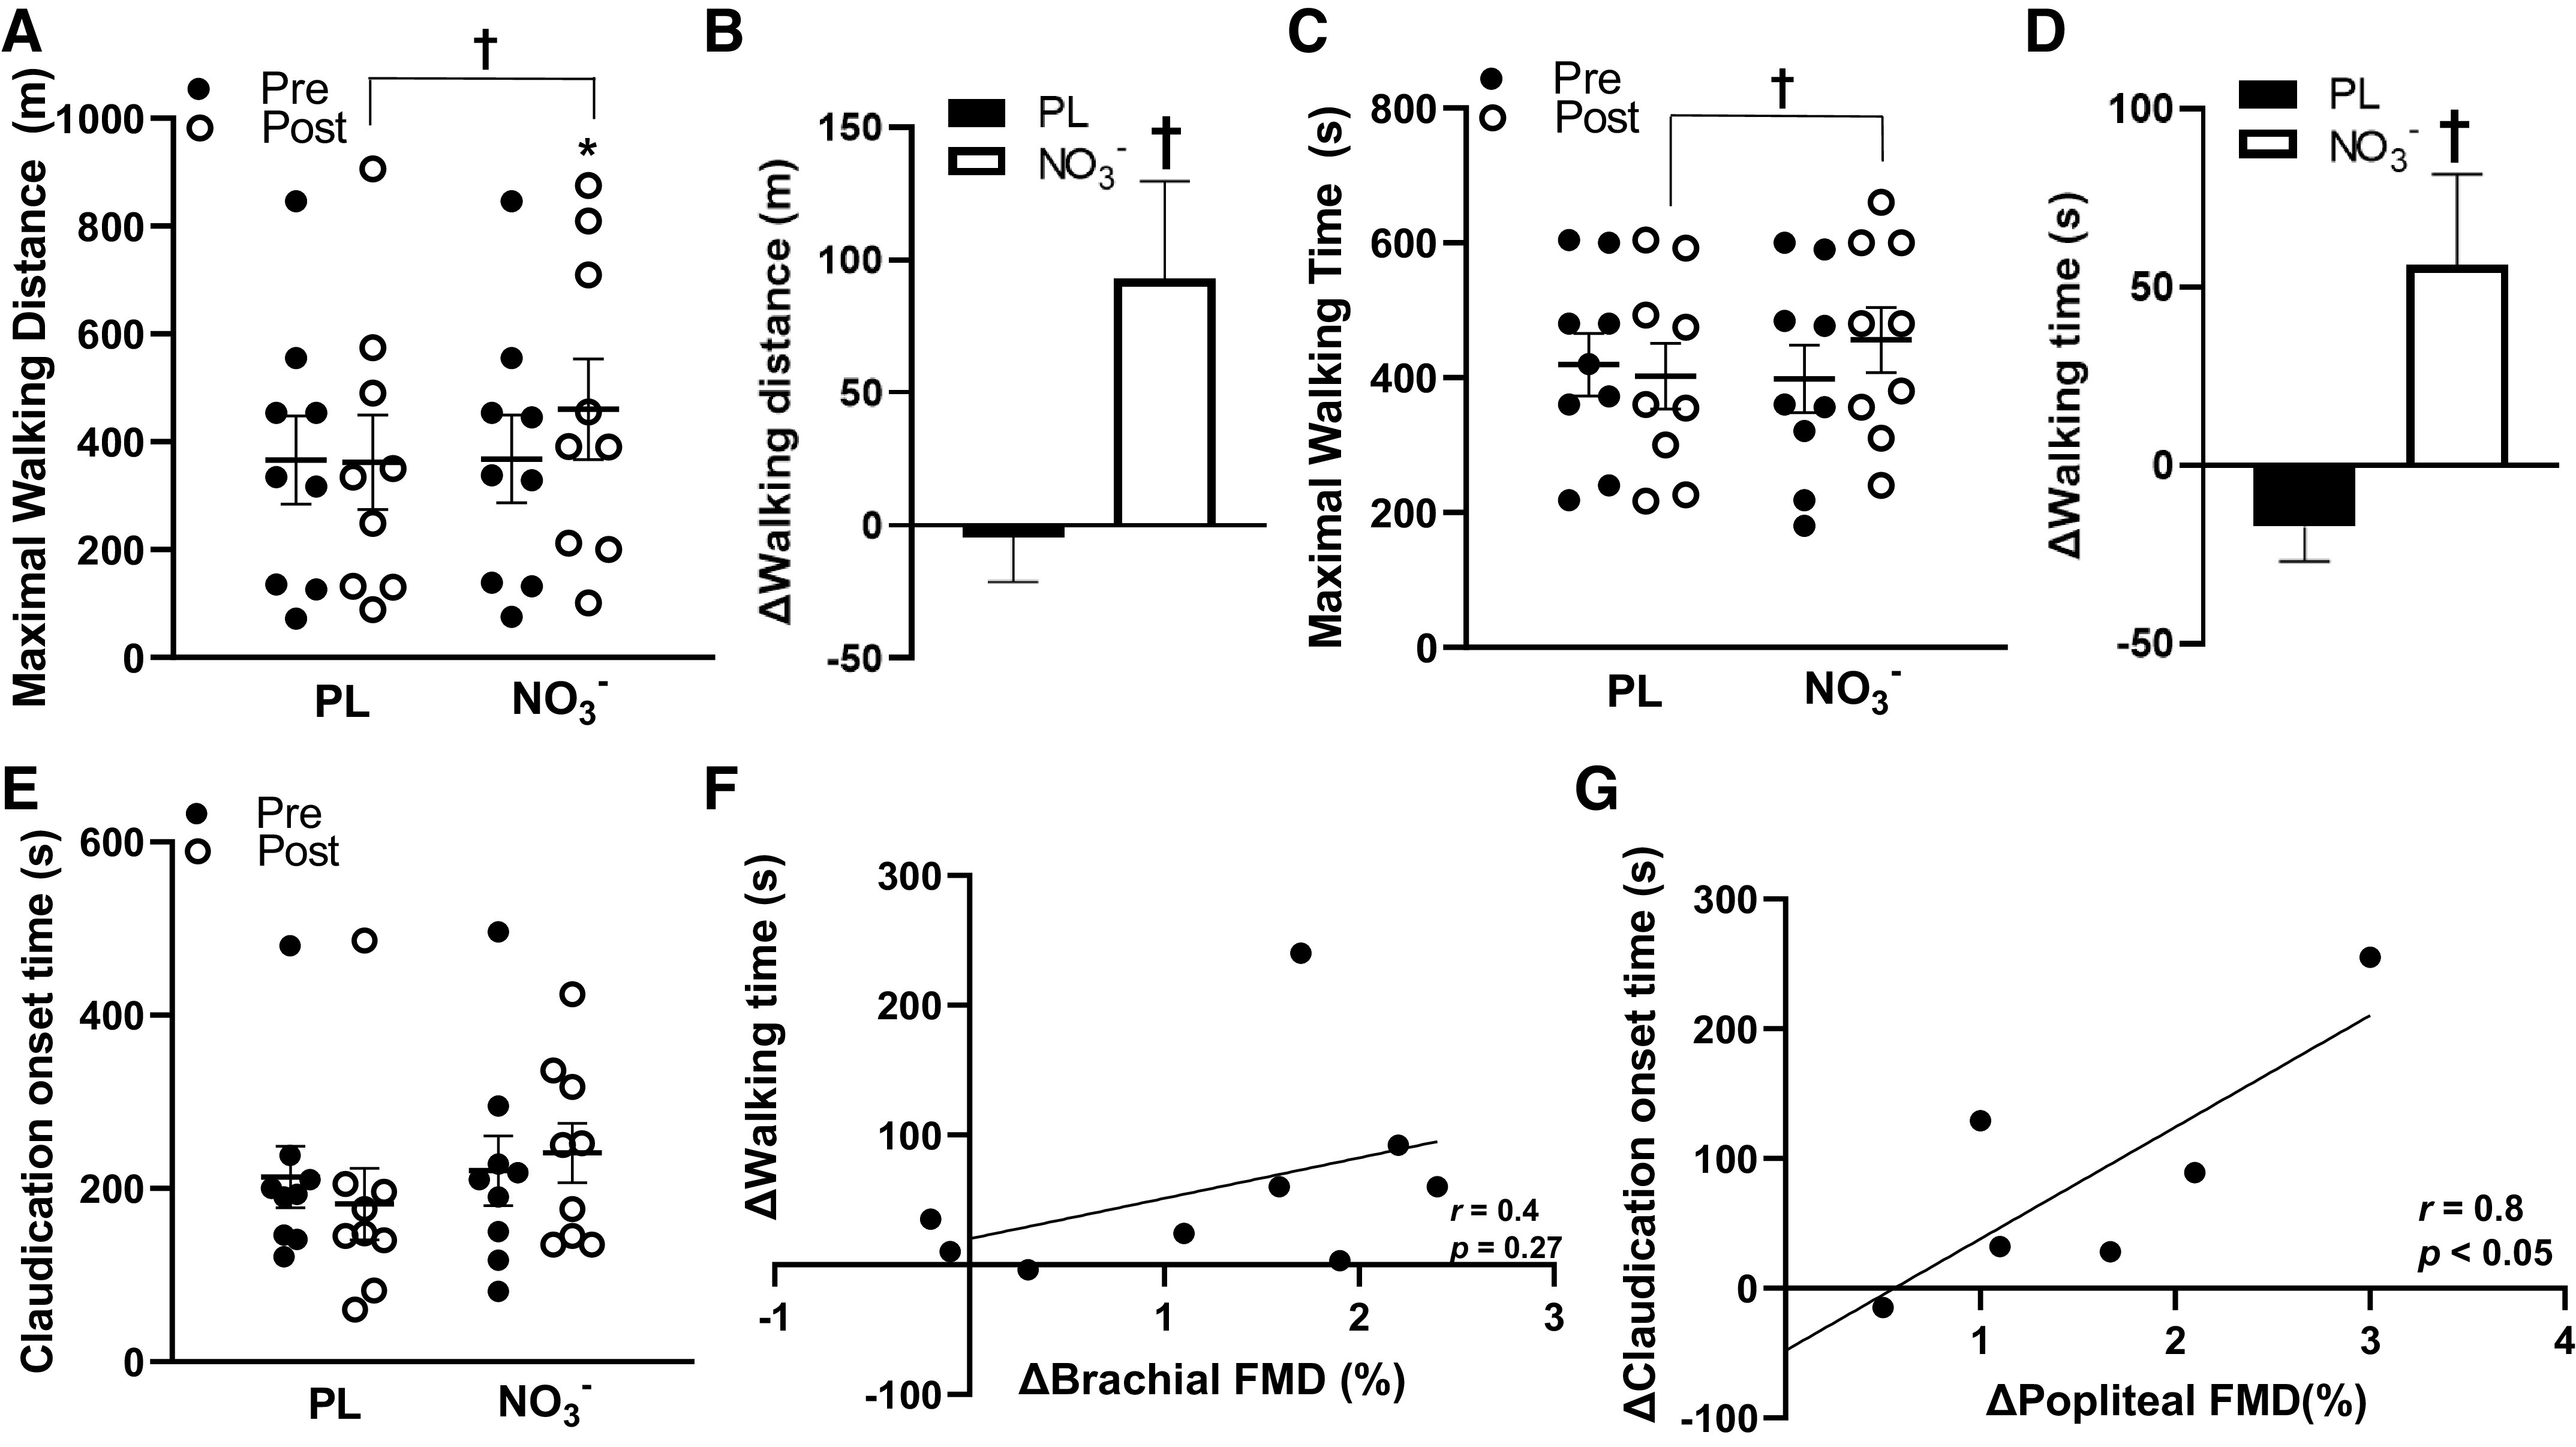
Figure 4.

Maximal walking time (s), maximal walking distance (m), and time to claudication(s) pre- and post-placebo (PL) and nitrate (NO3−) intake and relationships between changes in flow-mediated dilation (FMD), maximal walking time, and time to onset of claudication in the NO3− group. A: maximal walking distance significantly increased post-NO3− and was significantly greater than post-PL (n = 9, d = 0.4). B: changes in maximal walking distance in the PL and NO3− groups. C: maximal walking time was significantly greater in post-NO3− compared with post-PL (n = 9, d = 0.4). D: changes in maximal walking time in the PL and NO3− groups. E: there were no significant changes in time to onset of claudication pre- or post-PL or NO3− intake (n = 9, d = 0.5). F: positive relationship between changes in walking time (s) and changes brachial FMD (%) in the NO3− group (n = 9, r = 0.4, P = 0.27). G: positive relationship between changes in time to onset of claudication(s) and changes popliteal FMD (%) in the NO3− group (n = 6, r = 0.8, P < 0.05). Values are presented as means ± SE. Two-way repeated analysis of variance (ANOVA) [group (NO3− and PL) x time (before and after supplement intake)] with paired t tests for post hoc comparisons. Pearson’s product-moment correlation coefficient was used for correlations. Effect size analyses were conducted using Cohen’s d. *P < 0.05 vs. Pre †P < 0.05 vs. PL.
