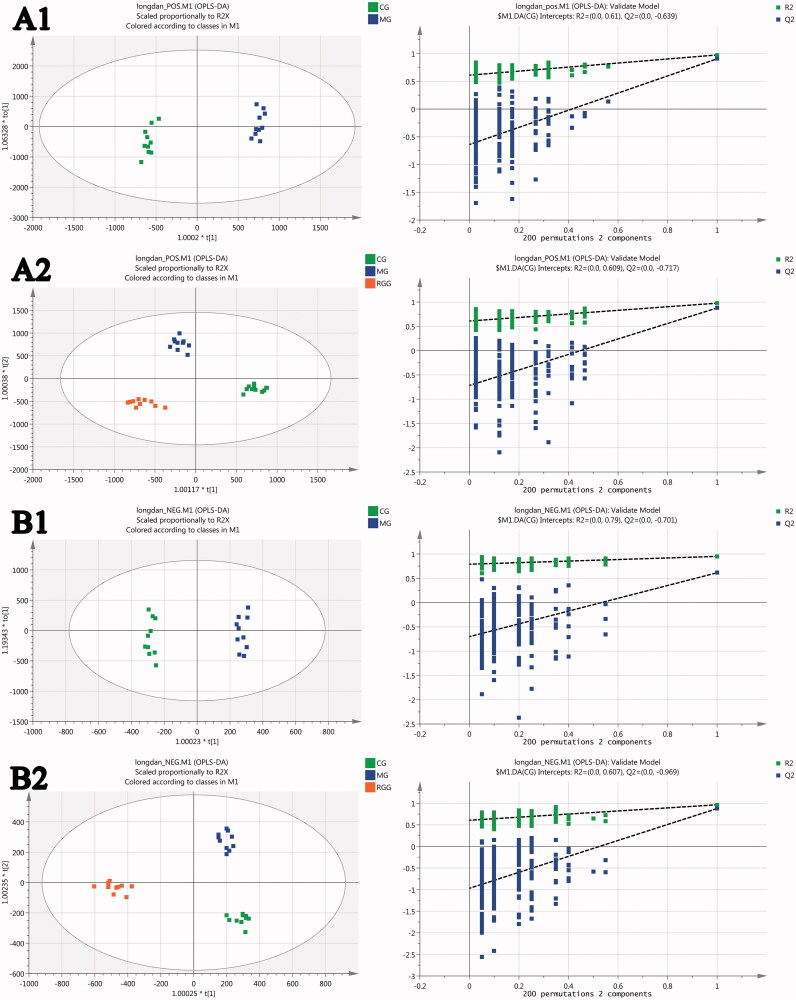
Figure 4.
The scores of orthogonal partial least squares discriminant analysis and their 200 times permutation tests: (A1) CG vs. MG score under positive ion mode; (A2) All groups score under positive ion mode; (B1) CG vs. MG score under negative ion mode; (B2) All groups score under negative ion mode (model parameters-A1: R2Y = 0.794, Q2 = 0.728; A2: R2Y = 0.978, Q2 = 0.876; B1: R2Y = 0.994, Q2 = 0.968; B2: R2Y = 0.973, Q2 = 0.894).

