Figure 8.

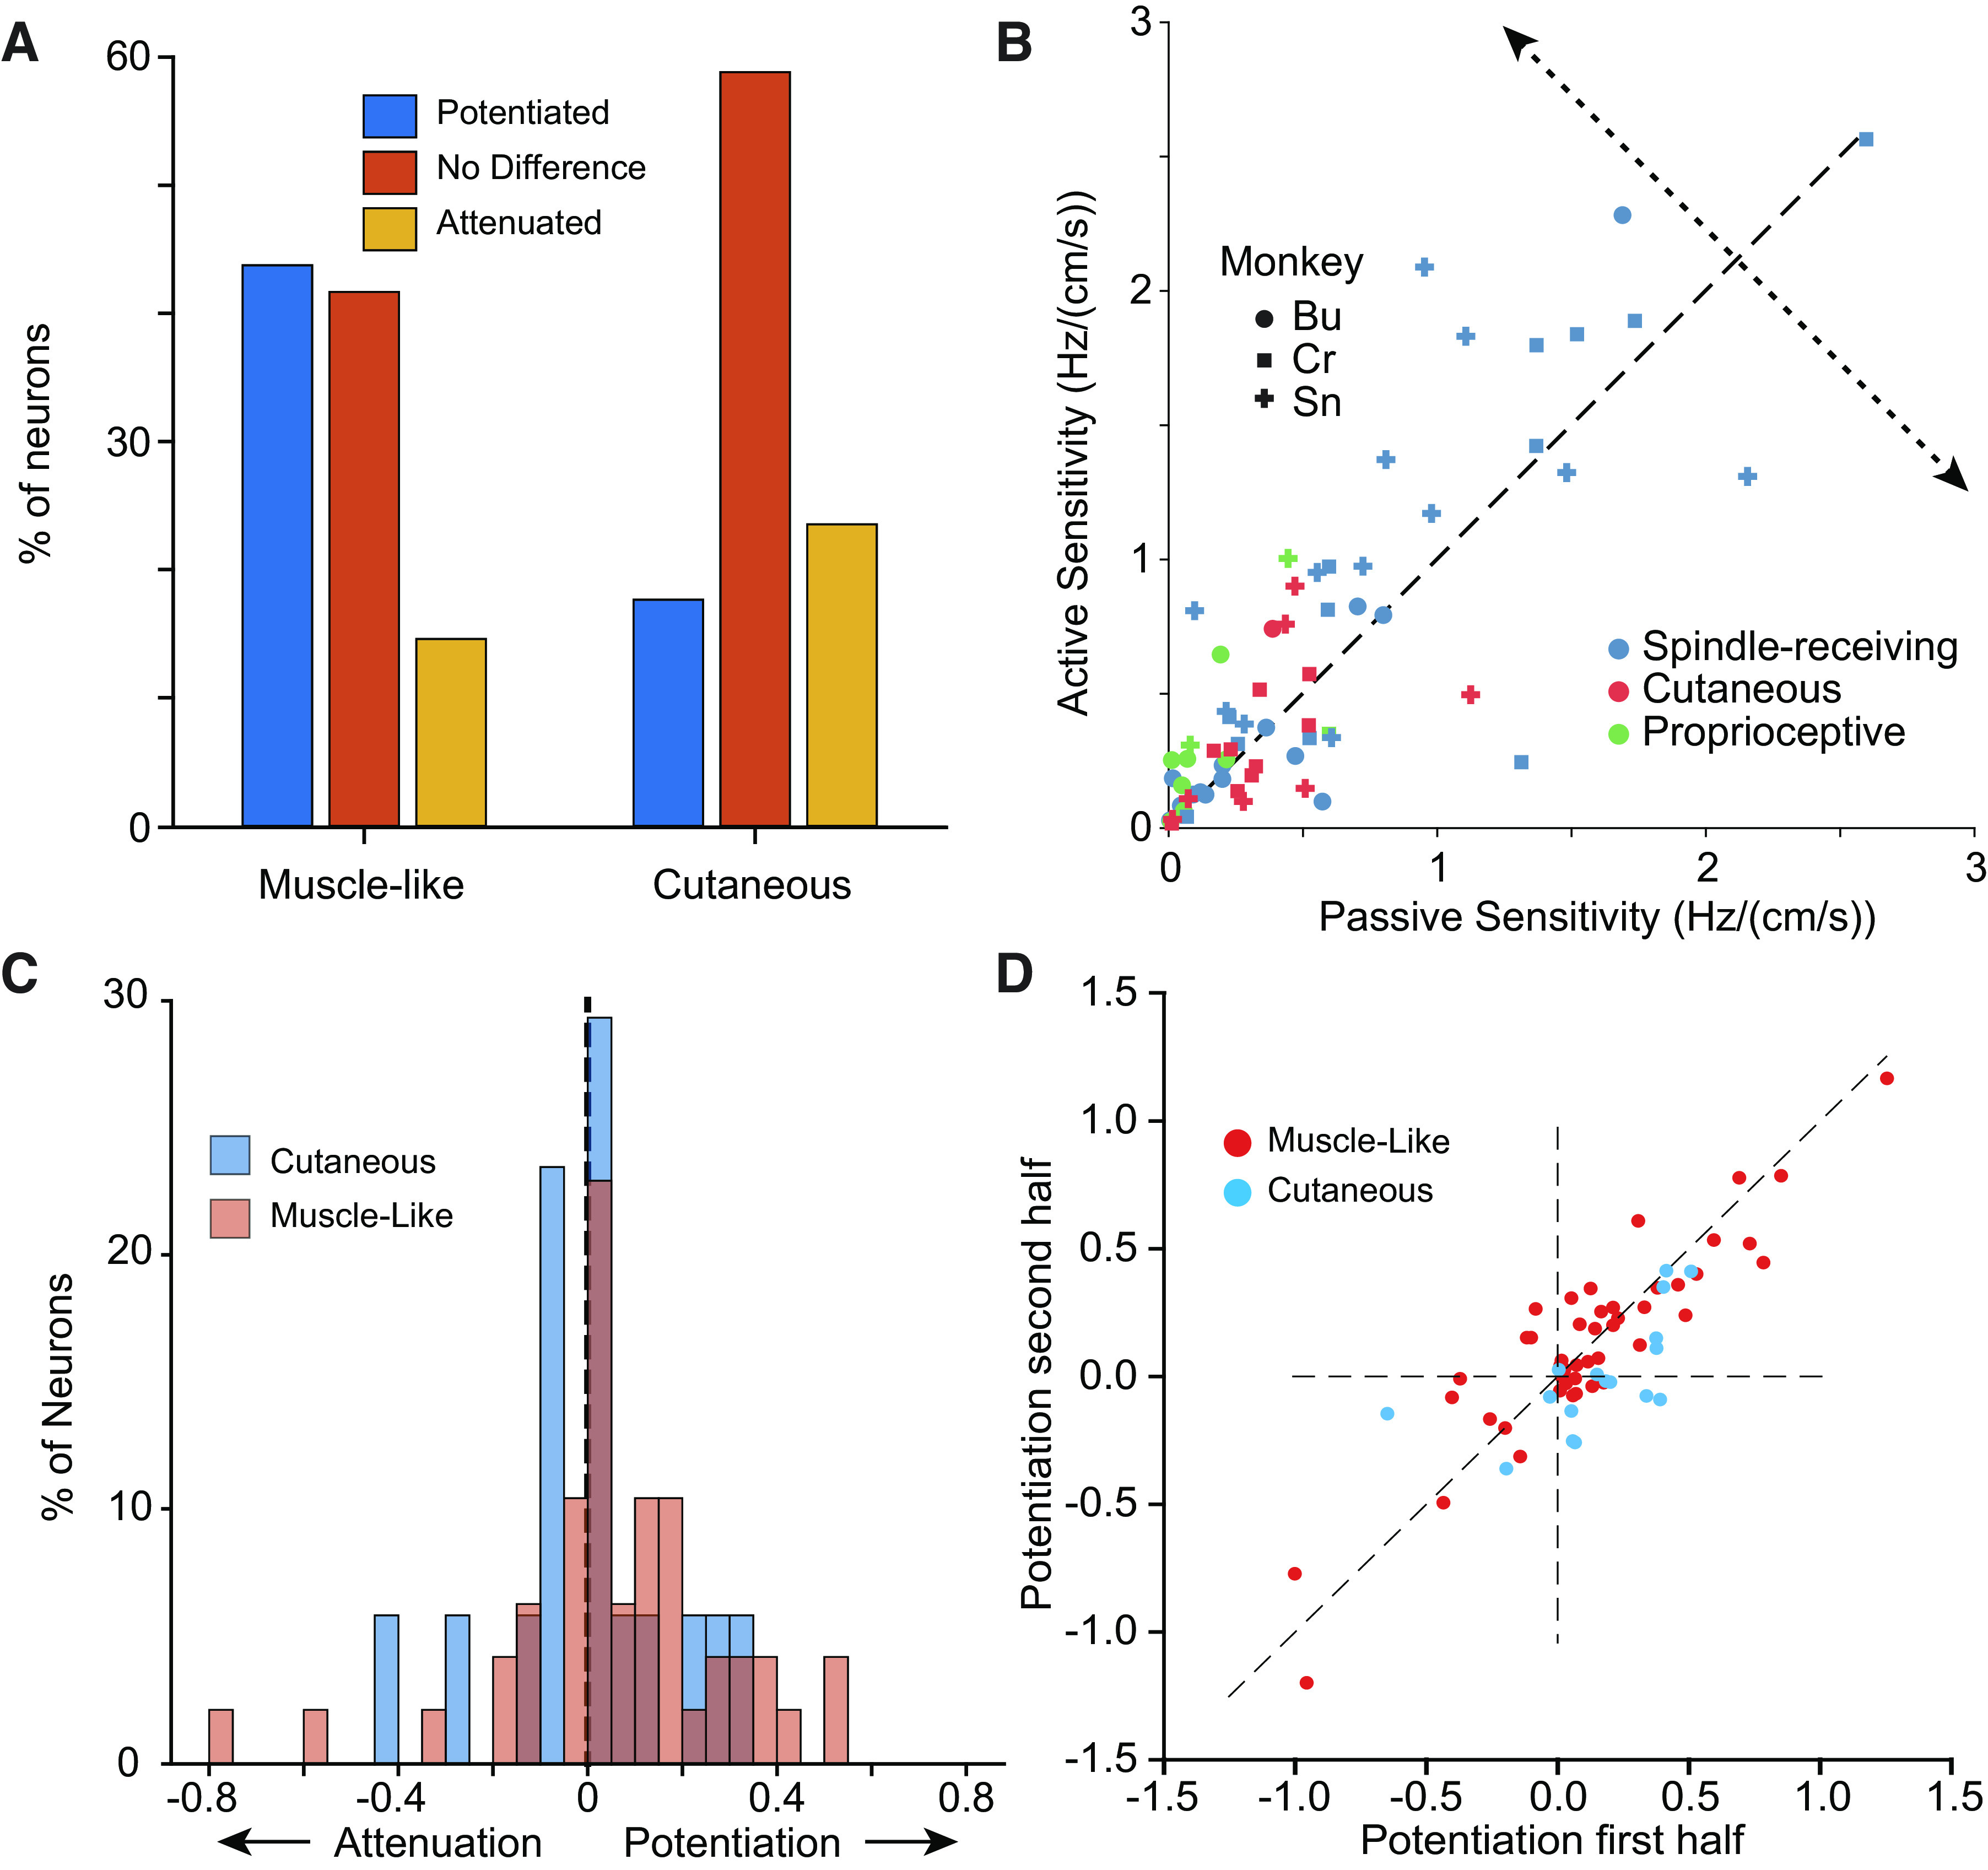
Sensitivity of neurons is modulated by movement context. A: distribution of sensitivity changes with reaching across all neurons by modality (two experimental sessions from each monkey, n = 48). B: scatter plot of active sensitivity as a function of passive sensitivity for CN neurons that were sinusoidally tuned in either condition, and with RFs that didn’t include the distal arm. The potentiation axis (dotted line) indicates change in sensitivity of active reaching vs. passive perturbation. Symbol shape indicates the monkey from which the neuron was recorded. Symbol color indicates the sensory modality of the neuron. C: magnitude of the potentiation across neurons. Although muscle-like neurons (red) yielded positive gains (two-sided t test, n = 48, P = 0.037), cutaneous neurons were not more significantly more prone to potentiation or attenuation (blue, two-sided t test, n = 17, P = 0.96). D: scatter plot of the potentiation effect in the second half of a given experimental session plotted against that in the first half, for all monkeys. CN, cuneate nucleus; RF, receptive field.
