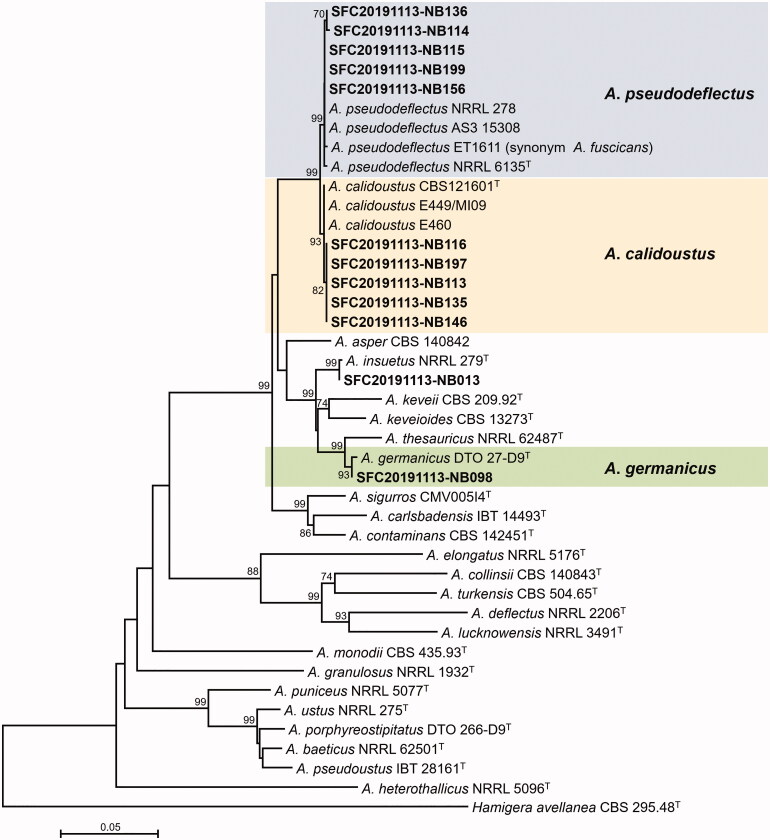
Figure 2.
Maximum likelihood (ML) phylogenetic tree of Aspergillus sect. Usti based on the combined data set of BenA and CaM sequences. Bootstrap values >70 are presented at the nodes. The scale bar represents the number of nucleotide substitutions per site. “T” indicates the ex-type strains. Aspergillus reported in this study are represented in bold. The unrecorded Aspergillus species are accented in color box.

