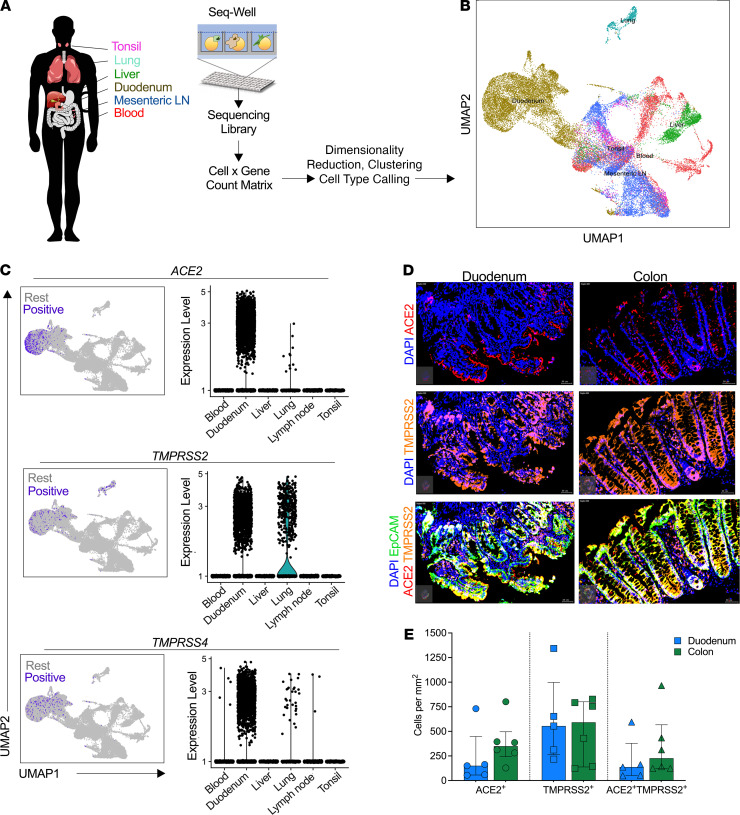
Figure 1. SARS-CoV-2 putative target cells are enriched in the human duodenum.
(A) Schematic of protocol for isolation of different tissues for scRNA-Seq using Seq-Well S3, to identify cell types. (B) Uniform manifold approximation and projection (UMAP) of 32,381 cells colored by tissue source. (C) Left: UMAP of epithelial cells showing expression of ACE2 (top), TMPRSS2 (middle), and TMPRSS4 (bottom) among all tissue sources from human donors. Color coding is as follows: purple, RNA positive; gray, RNA negative. Right: Corresponding violin plots of expression values for ACE2 (top), TMPRSS2 (middle), and TMPRSS4 (bottom). (D) Representative fluorescence immunohistochemistry image of gut tissue showing ACE2 (red), TMPRSS2 (orange), EpCAM (green), and DAPI (blue) of duodenum and colon. Bars: 20 μm for all images. (E) Quantification of ACE2 and TMPRSS2 proportion of total cells stained with EpCAM. Data shown as median ± SD.

