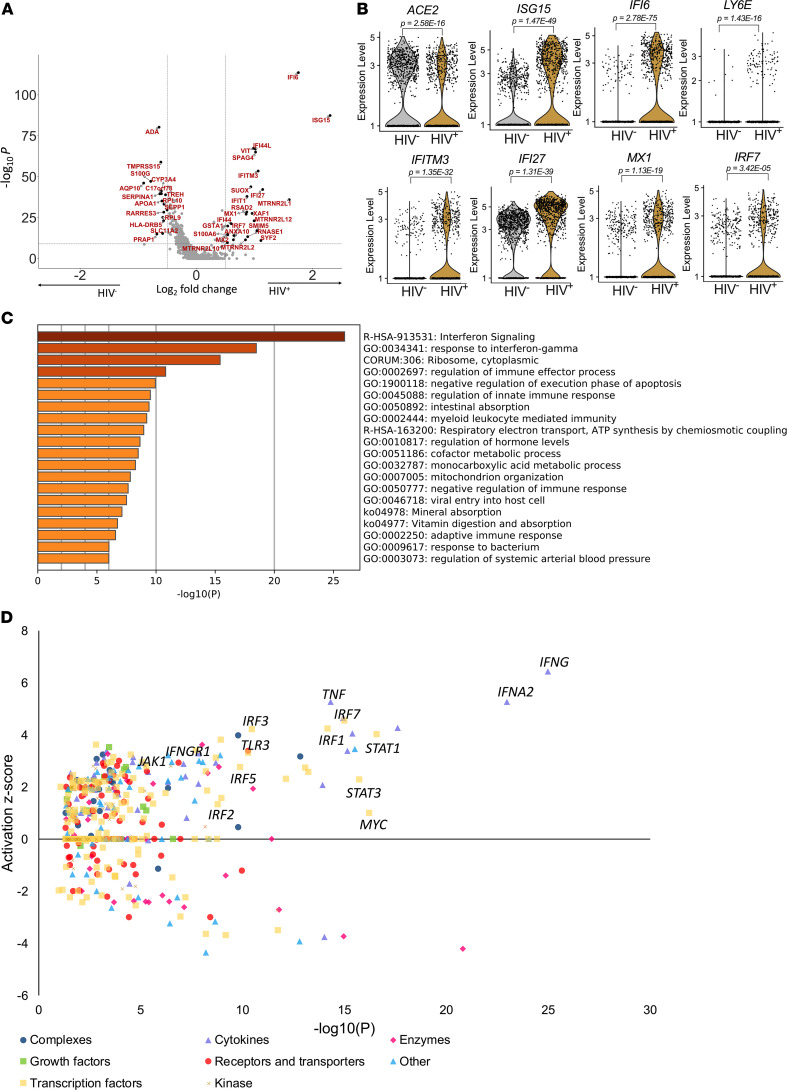
Figure 4. HIV infection downregulates ACE2 expression and drives interferon signaling in absorptive enterocytes.
(A) Volcano plot of DEGs (Supplemental Table 3B) within absorptive enterocytes in HIV-infected and HIV-uninfected cells highlighting genes with more than 0.5-fold change and adjusted P < 5.0 × 10⁸. (B) Violin plots of expression of ACE2 and interferon-responsive genes among absorptive enterocytes from HIV– (n = 4) and HIV+ART+ (n = 5). (C) GO BP enrichment analysis of the DEGs of absorptive enterocytes upregulated in HIV– (n = 4) and HIV+ART+ (n = 5). P value was derived by a hypergeometric test. (D) Activation z score of upstream drivers from DEGs shown in A and Supplemental Table 3D color-coded by their functional categories.

