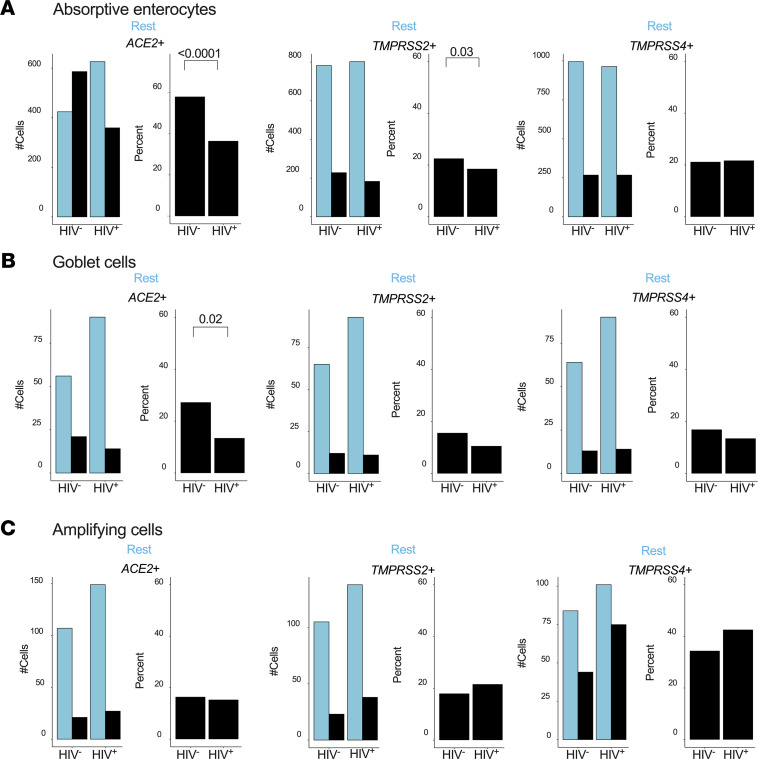
Figure 5. HIV infection reduces the frequency of SARS-CoV-2 putative target cells within the small intestine.
(A) Actual number of absorptive enterocytes (left) and percentage expression (right) of ACE2, TMPRSS2, and TMPRSS4 by HIV status. (B) Number of goblet cells (left) and percentage (right) expressing ACE2, TMPRSS2, and TMPRSS4 by HIV status. (C) Number of transit-amplifying cells (left) and percentage (right) expressing ACE2, TMPRSS2, and TMPRSS4 by HIV status. P values by Fisher’s Exact Test. Rest, cells not expressing the indicated transcript.

