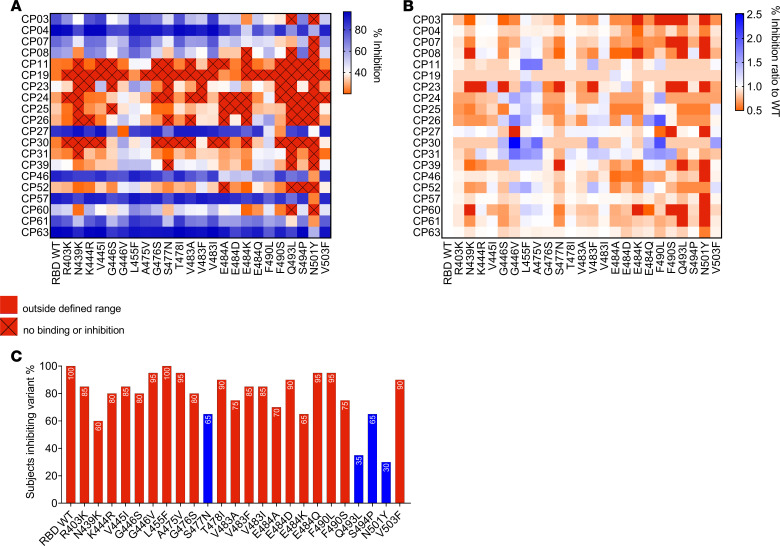
Figure 5. Mapping mutations to the RBD that affect inhibition of ACE-RBD by polyclonal antibodies.
(A) Percentage ACE2-RBD inhibition of a panel of n = 20 convalescent samples (1 in 100 plasma dilution), demonstrating inhibition of RBD WT-ACE2 binding, mapped to the array of RBD variants in the multiplex assay. (B) Percentage ACE2 inhibition ratio to the WT for each subject to each RBD variant. (C) Percentage of subjects who were able to block (inhibition > 20%) binding to each RBD variant in the array. Data represent the mean of replicates. Blue bars highlight variants observed to demonstrate a high affinity to ACE2 via BLI and the multiplex assay.

