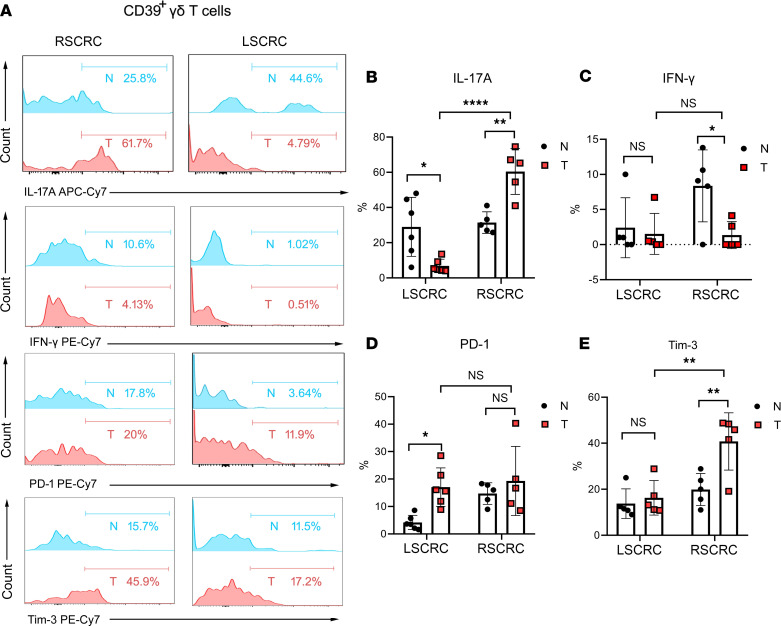
Figure 2. Differentiation phenotype of CD39+γδ Tregs in RSCRC/LSCRC.
(A) Representative histogram plot of the expression of IL-17A/IFN-γ/PD-1/Tim-3 in/on CD39+ Tregs derived from LSCRC/RSCRC. (B–E) The percentages of IL-17A (B), IFN-γ (C), PD-1 (D), and Tim-3 (E) in CD39+γδ T cells was calculated. Data are shown as mean ± SEM, using 2-way ANOVA followed by Sidak’s multiple-comparisons test. RSCRC, n = 5; LSCRC, n = 6. Each dot represents 1 patient. N, normal; T, tumor; RSCRC, right-sided colorectal cancer; LSCRC, left-sided colorectal cancer. *P < 0.05, **P < 0.01, ****P < 0.0001.

