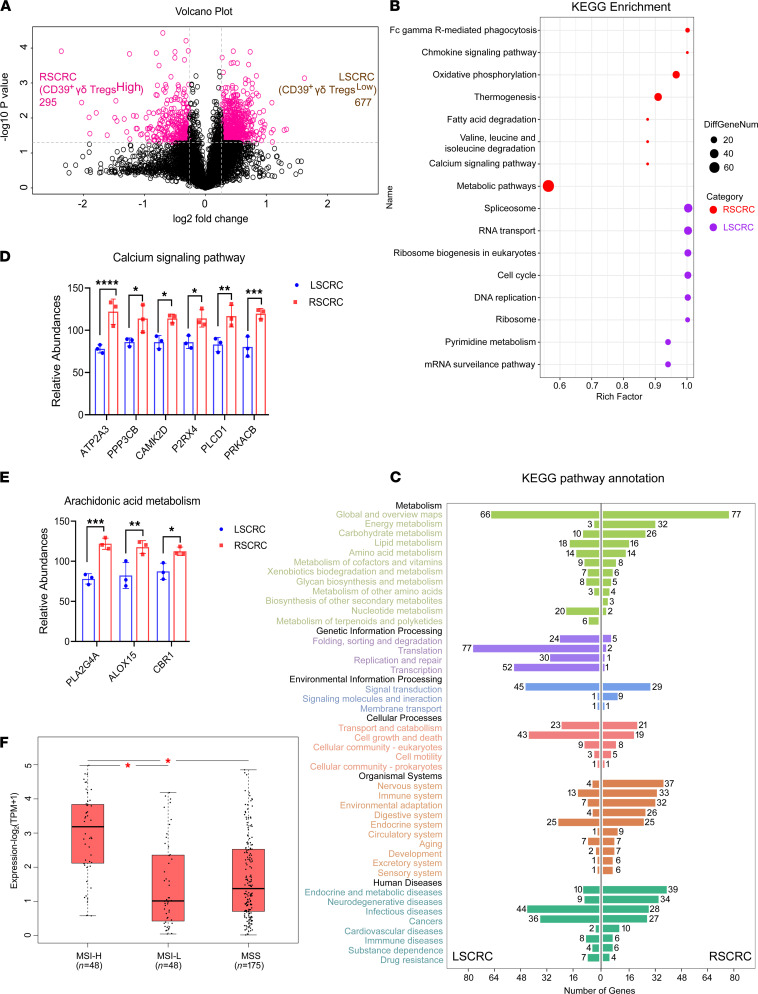
Figure 4. Difference of microenvironment between RSCRC and LSCRC.
(A) The surgical specimens of RSCRC (n = 3) with high expression of CD39+γδ Tregs and the LSCRC (n = 3) with low expression of CD39+γδ Tregs detected by flow cytometry were then analyzed by tandem mass tag–based (TMT-based) quantitative proteomics. The profiling experiments resulted in quantification of 972 differential proteins — among them, 295 high expression proteins were found in RSCRC and 677 in LSCRC. A volcano plot indicating results from protein-level differential analysis comparing RSCRC with LSCRC samples. Dotted lines indicated that the cut-offs used to define regulated proteins (|log2 FC| > 1.2, adjusted P < 0.05). (B) A bubble chart displayed KEGG enrichment pathway of abnormal expression proteins in RSCRC/LSCRC. (C) Bar plot of secondary classification of KEGG pathway annotation highlighted features of RSCRC/LSCRC microenvironment. (D and E) The expression of calcium signaling pathway–related proteins (D) and arachidonic acid metabolism–related proteins (E) in RSCRC and LSCRC analyzed by quantitative proteomics. Data represent mean ± SEM, using 2-way ANOVA followed by Sidak’s multiple-comparisons test. (F) PLA2G4A mRNA expression in colorectal cancer with MSI-high/MSI-low or MSS based on data obtained from the GEPIA database. One-way ANOVA test was used. MSI, microsatellite instability; MSS, microsatellite stable. *P < 0.05; **P < 0.01; ***P < 0.001; ****P < 0.0001.

