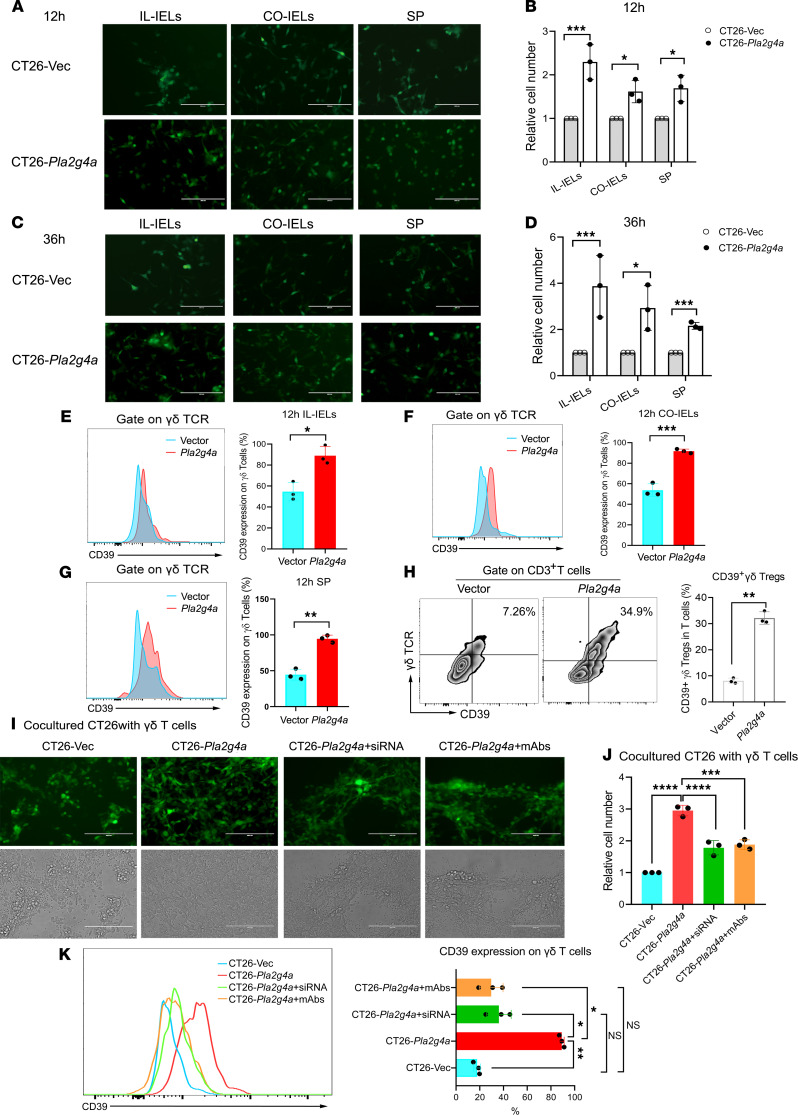
Figure 5. Overexpression of Pla2g4a in CT26-induced CD39+γδ Tregs in vitro.
CT26-Pla2g4a and CT26-Vec cells were cocultured with intraepithelial lymphocytes derived from the ileum (IL-IELs), colon (CO-IELs), or spleen of BALB/c mice. (A and C) Representative pictures showed the number of CT26 cells in the coculture system after 12 (A) and 36 hours (C). Scale bars: 200 μm. (B and D) Bar diagrams summarizes the cell numbers of CT26-Pla2g4a and CT26-Vec cells cocultured with IL-IELs after 12 (B) and 36 (D) hours. Data are shown as mean ± SEM, using 2-way ANOVA followed by Sidak’s multiple-comparisons test. (E–G) Representative histogram plot and bar diagram summarizes the expression of CD39 on γδ T cells in IL-IELs (E), CO-IELs (F) and splenocytes (G) group. (H) Representative flow cytometric analysis of CD39+ Tregs in the total CD3+ T cells from splenocytes. Bar diagram summarizes the percentages of CD39+γδ Tregs. Unpaired 2-tailed t test was used to compare variables. (I) Silencing Pla2g4a in CT26-Pla2g4a rescued the antitumor response mediated by γδ T cells. CT26-Pla2g4a were transfected with Pla2g4a siRNA or control siRNA. After 24 hours, CT26-Vec, CT26-Pla2g4a, and CT26-Pla2g4a–knock-down cells were cocultured with γδ T cells sorted from BALB/c mice with or without anti-PLA2G4A antibody (5 mg/mL). Scale bars: 200 μm. (J) Bar diagram summarizes the cell number of CT26. (K) Representative histogram plot of CD39 expression on γδ T cells in each group by flow cytometry. Bar diagram summarizes the frequency of CD39+ γδ Tregs/γδ T cells. One-way ANOVA followed by Tukey’s multiple-comparison test was used for multiple-group analysis. All of the experiments were repeated 3 times; n = 3/group. *P < 0.05, **P < 0.01, ***P < 0.001, ****P < 0.0001.

