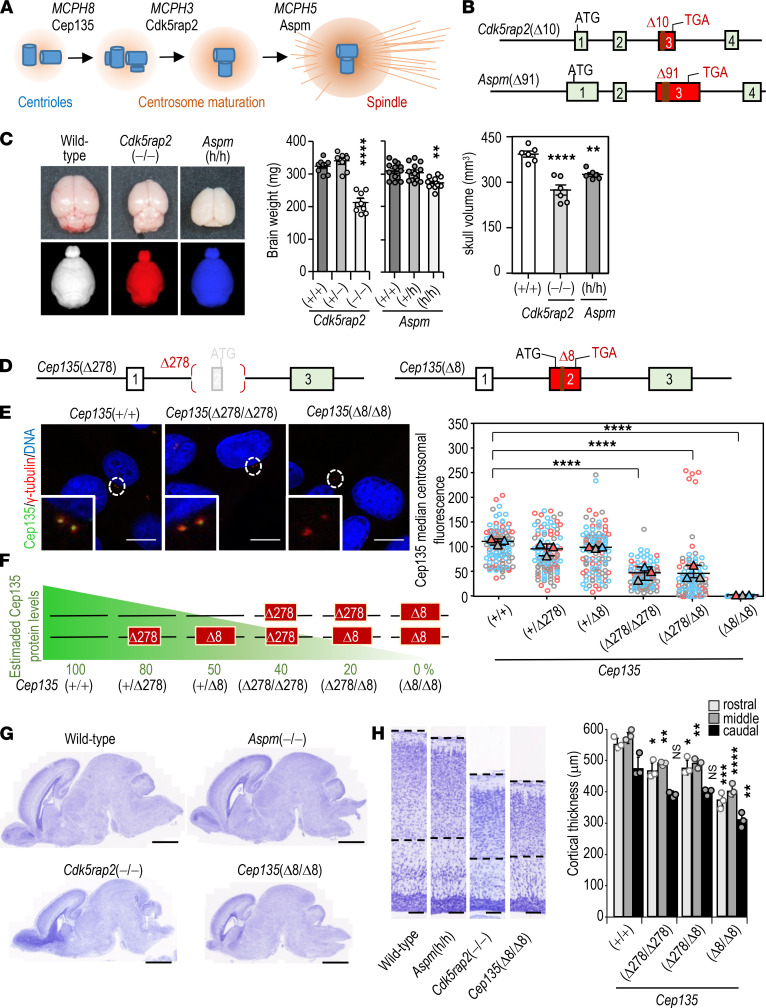
Figure 1. A comparative analysis of MCPH models in the mouse.
(A) Role of MCPH8 proteins in centriole duplication, centrosome maturation, and spindle pole formation, respectively. (B) Generation of the Cdk5rap2(–)(Δ10) and Aspm(h)(Δ19) alleles by CRISPR/Cas9 editing in mouse embryos. (C) Representative images of brains derived from P30 mice (upper) and skull volumes as scored by CT-scan analysis (lower). Histograms to the right depict the quantifications of brain weight of P30 Cdk5rap2-mutant (n = 8) and Aspm-mutant (n = 12) mice and the skull volume at P30 (n = 6/group). (D) Generation of the Cep135(Δ278) and Cep135(Δ8) alleles. The Cep135(Δ278) allele lacks the initial ATG site. The Δ8 allele generates of a premature stop codon in exon 3. (E) Confocal imaging of centriolar loading of CEP135 (green) in MEFs with different combinations of Cep135(Δ278)-mutant and Cep135(Δ8)-mutant alleles. γ-Tubulin, red; CEP135, green; DNA, blue. Stained with DAPI. Scale bars: 10 μm. The superplot to the right shows the quantification of CEP135 centrosomal protein levels in cells with the indicated genotypes. Each color represents data from a different mouse. Horizontal bars depict the mean; ***P < 0.001 (unpaired t test with Welsh correction). (F) A summary of the effect of the different Cep135 alleles in the centrosomal levels of CEP135. (G) Representative micrographs of sagittal brain sections stained with Nissl at P0 in neonate Aspm, Cdk5rap2, and Cep135 mutants. Scale bars: 1 mm. (H) Histological Nissl staining of P0 cortices from the indicated mice (left panels). Scale bars: 100 μm. Quantification of cortical thickness in rostral, medial, and caudal aspects of P0 Cep135-mutant mice versus Cep135(+/+) controls (histogram to the right). Data in C and H represent mean ± SEM from 3 different mice or embryos; *P < 0.05; **P < 0.01; ***P < 0.001; ****P < 0.0001; 1-way ANOVA with Tukey’s multiple comparisons.

