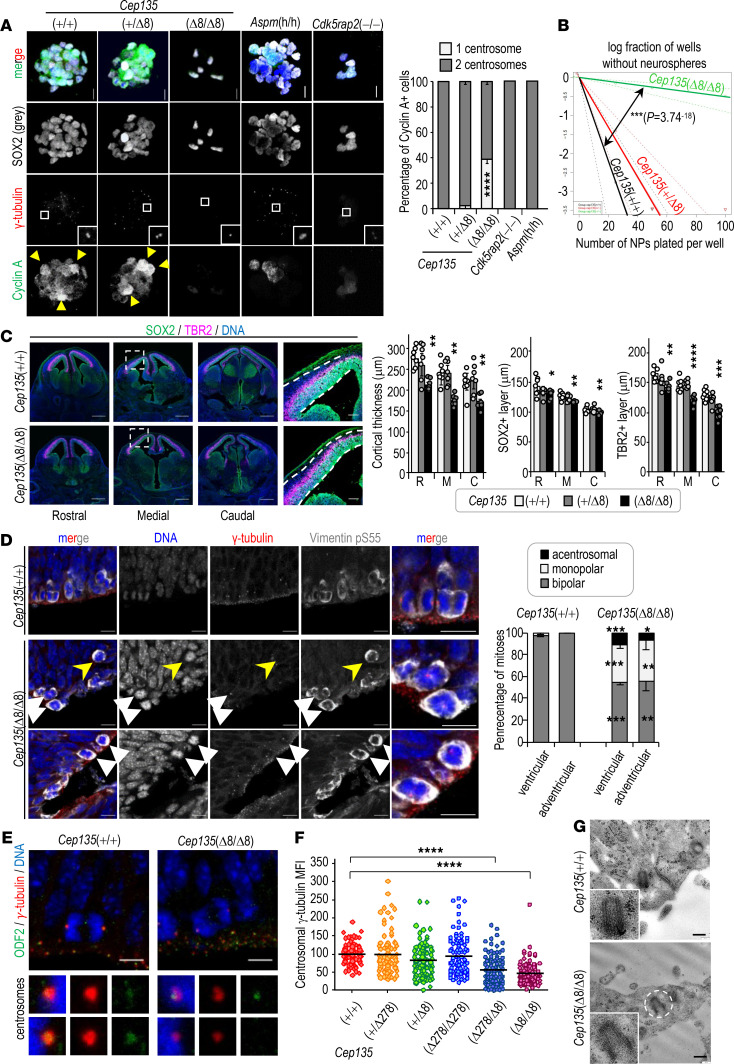
Figure 3. Self-renewal ability and centrosome dynamics in Cep135-mutant neural progenitors.
(A) Confocal imaging of neurospheres derived from E14.5 embryonic cortices stained with the indicated antibodies, and percentage of cyclin A+ cells with 1 or 2 centrosomes. (B) Self-renewal ability of neural progenitors as determined by limiting dilution assays. (C) Confocal imaging of cryosections of the rostral, medial, and caudal aspects of E14.5 embryonic brains with the indicated markers. Scale bar: 1 mm (left) and 100 μm (insets). Quantification of the thickness (left), SOX2+ cells (middle), and TBR2+ cells (right) in rostral (R), medial (M), and caudal (C) regions. (D) Immunofluorescence with the indicated antibodies in developing E14.5 neocortices. Control samples show typical bipolar spindles, whereas monopolar spindles (white arrowheads in middle panels), acentrosomal spindles (yellow arrowheads), and asymmetric centrosomes (arrowheads in bottom panels) are observed in Cep135-mutant samples. Scale bars: 25 μm. The histogram shows the quantification of polarity in mitotic spindles (monopolar, bipolar, or acentrosomal) in ventricular or abventricular mitoses of E14.5 neocortices. (E) Immunostaining with the indicated antibodies of anaphases in the ventricular surface of E14.5 Cep135-mutant and control embryos. Higher-magnification images of mitotic centrosomes are displayed in the bottom panels. Scale bar: 10 μm. (F) Mean fluorescence intensity (MFI; arbitrary units) of γ-tubulin at the centrosome from NPs of the indicated genotypes. ****P < 0.0001 (unpaired t test with Welsh correction). (G) Transmission electron micrographs showing representative pictures of centrioles contained in the first layer of APs of the ventricular surface. Scale bars: 200 nm. Scale bars: 10 μm (A, D, and E). Arrowheads indicate Cyclin A+ cells (A), TP53+ cells (B), or apoptotic cells (C). In A–D, data are mean ± SEM. **P < 0.01; ***P < 0.001; ****P<0.0001; 1-way ANOVA with Tukey’s multiple-comparison test (A, C, and F), χ2 (B), Student’s t test (D).

