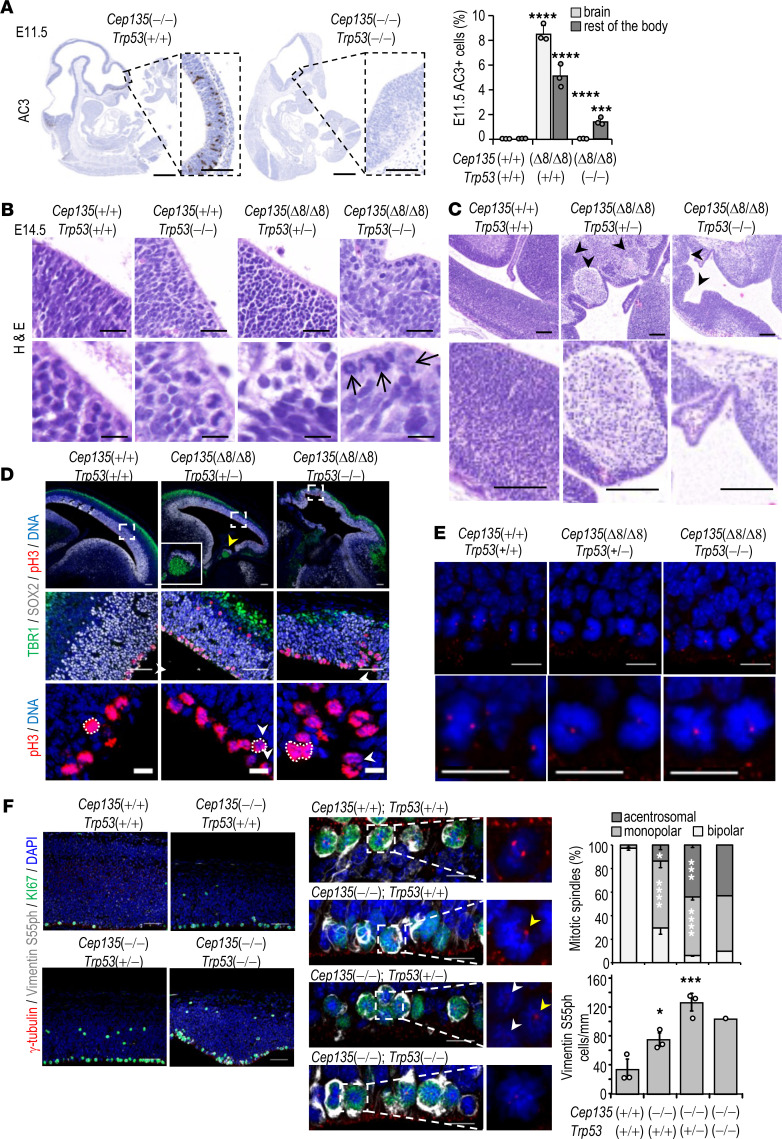
Figure 6. Genetic ablation of Trp53 in Cep135-KO embryos.
(A) IHC staining for active caspase 3 (AC3; brown) in the indicated models. Scale bars: 1 mm (whole embryos) and 100 μm (insets). In the quantification, data are mean SEM (3 embryos). **P < 0.01; ***P < 0.001 by Student’s t test. (B) H&E staining of the medial aspect of the neocortex of E14.5 embryos with the indicated genotypes. Scale bars: 20 μm (upper left), 10 μm (lower), and 100 μm (right). Arrows indicate aberrant mitotic figures of apical progenitors. Scale: 10 μm. (C) Histological sections of E14.5 neocortices of the indicated genotypes showing cortical heterotopias and malformations (arrowheads). Scale bars: 100 μm (upper) and 50 μm (insets). (D) Confocal imaging of E14.5 neocortices stained with the indicated antibodies (upper), and higher magnification confocal images showing the neocortical area delimited by slashed boxes (middle). Yellow arrowhead indicates a subcortical heterotopia. Higher-magnification inset in the middle panel shows CTIP2+ heterotopias. Bottom panels show APs with aberrant mitotic figures (arrowheads). Scale bars: 100 μm (upper), 50 μm (middle), and 10 μm (lower). (E) Confocal images of APs in the neocortices shown in D stained with the indicated antibodies. Scale bars: 10 μm. (F) Confocal micrographs of E14.5 neocortices stained with the indicated antibodies. The middle panels show higher-magnification images of the innermost APs with representative mitoses (insets) and monopolar spindles (yellow arrowheads), and acentromal cells (white arrowheads). Scale bars: 50 μm (left), 10 μm (middle), 10 μm (right). Asterisks indicate comparison with Cep135(+/+); Trp53(+/+) controls. Data are mean SEM from 3 embryos (1 for Cep135; Trp53 homozygous mutants). *P < 0.01; ***P < 0.001; ****P < 0.0001; 1-way ANOVA with Tukey’s multiple-comparison test.

