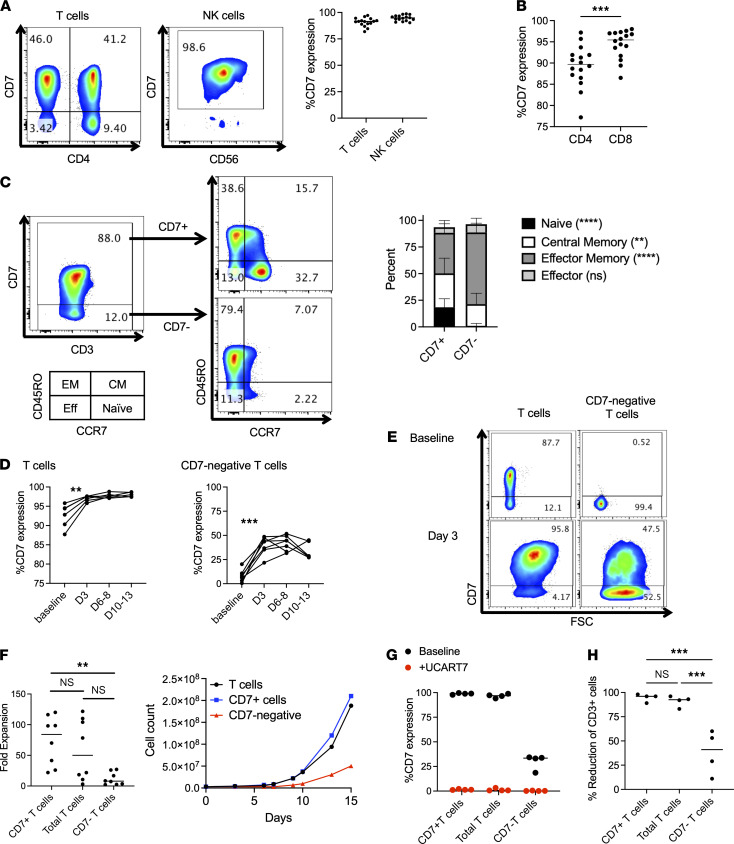
Figure 1. CD7– T cells have limited proliferative capabilities and are potentially still susceptible to UCART7 after activation.
(A–C) CD7 expression on healthy T and NK cells was measured by flow cytometry (n = 16 donors). (A) CD7 expression on T cells and NK cells. (B) CD7 expression on CD4+ and CD8+ T cell subsets (paired 2-tailed Student’s t test). (C) CD7– T cells exhibit a predominantly effector memory phenotype. Memory phenotype was defined by CD45RO and CCR7 expression, as depicted in the left panel. Asterisks denote statistical comparisons of the frequency of each group within CD7+ versus CD7– cells by 2-way ANOVA with multiple comparisons. (D–F) T cells were divided into CD7+ and CD7– fractions and activated with anti-CD3/CD28 beads, followed by serial cell counts and flow cytometry to evaluate CD7 expression (n = 8 donors). (D) CD7 expression significantly increases after T cell activation with anti-CD3/CD28 beads in both bulk T cells (left) and CD7– cells (right) (paired 2-tailed Student’s t test). (E) Representative flow cytometry plots showing increased CD7 expression in total and CD7– T cells after activation. (F) Maximum fold-expansion of CD7+, total, and CD7– T cells (1-way ANOVA with Tukey’s multiple-comparison test). Representative growth curve is shown on the right. (G and H) Activated T cells were incubated with UCART7 for 48 hours, after which cell counts and percentage of CD7 of remaining CD3+ T cells were quantified by flow cytometry (n = 4 donors). All numbers are averages of 3 technical replicates. (G) Percentage of CD7 expression on CD3+ T cells at baseline and after incubation with UCART7. (H) Percent reduction of CD3+ T cells in each group after UCART7 treatment, calculated as the number of CD3+ cells in UCART7-treated groups divided by the number of CD3+ cells in untreated groups (1-way ANOVA with Tukey’s multiple-comparison test). **P < 0.01, ***P < 0.001, ****P < 0.0001.

