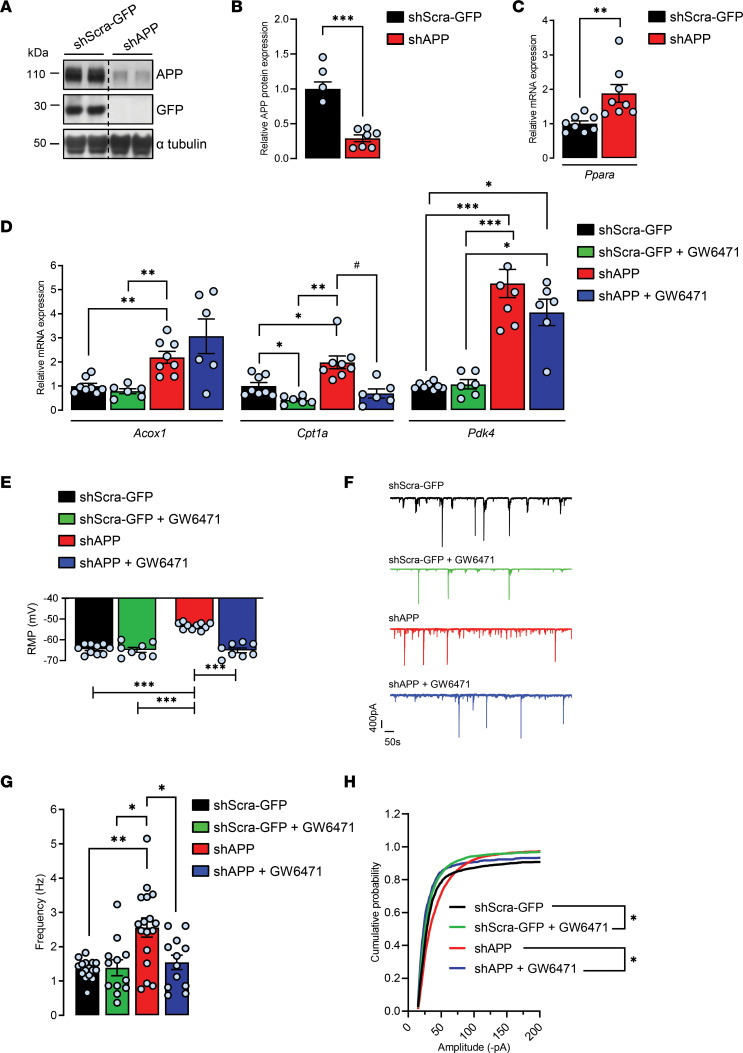
Figure 4. Pharmacological PPARα inhibition with GW6471 prevents APP knockdown–induced increases in the expression of PPAR target genes and synaptic activity in cortical cultures.
Primary cultures of rat cortical cells expressing a shRNA targeting endogenous APP (shAPP) or a scrambled shRNA encoding GFP (shScra-GFP). At 13–14 DIV, cells were treated (+) or not (-) with PPARα antagonist GW6471 for 24 hours. (A) Representative immunoblot of cell lysates, 4 independent experiments (the lanes were run on the same gel but were noncontiguous). (B) APP expression/α-tubulin ratios (n = 7 of each analyzed in 4 independent experiments), mean ± SEM; Student’s t test (APP, P < 0.001). (C and D) Real time PCR analyses for Ppara, Acox1, Cpt1a, and Pdk4 mRNA levels (n = 6–8 for each condition analyzed in 6 independent experiments). Results were normalized to Rpl32 mRNA and compared with respective untreated (-) shScra-GFP control cells. Results are shown as mean ± SEM; Brown-Forsythe and Welch 1-way ANOVA tests followed by Dunnett’s T3 multiple comparisons test: (-) shAPP vs. (-) shScra-GFP: Ppara mRNA, P = 0.006, Acox1 mRNA, P = 0.008, Cpt1a mRNA, P = 0.043; Pdk4 mRNA, P = 0.0009; (+) shScra-GFP vs. (-) shScra-GFP: Cpt1a mRNA, P = 0.026; (+) shAPP vs. (-) shAPP: Cpt1a mRNA, P = 0.010. (E) RMP (n = 8–10 cells per group analyzed in 3 independent experiments). (F) Representative traces of total synaptic activity and (G) mean values of synaptic events’ frequency (n = 12–17 cells per group analyzed in 6 independent experiments). (H) Cumulative probability plot of the amplitude distribution (n = 15–27 cells per group in 7 independent experiments). (E–H) Brown-Forsythe and Welch 1-way ANOVA tests followed by Dunnett’s T3 multiple comparisons test. *P < 0.05, **P < 0.01, ***P < 0.001, #P < 0.05.

