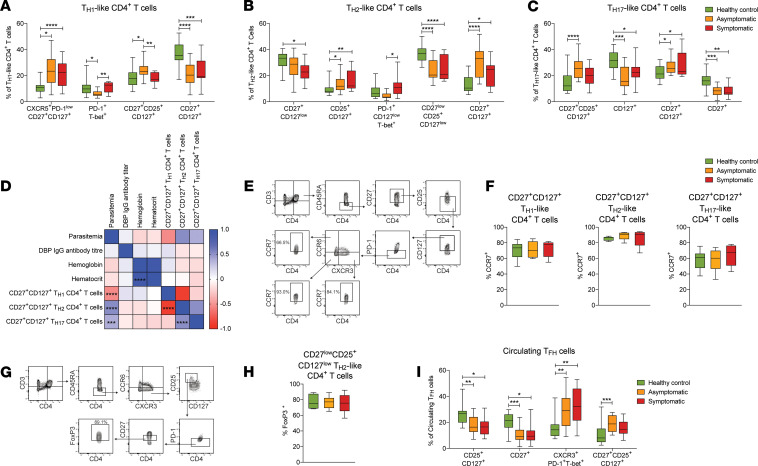
Figure 4. CD4+ T cell populations with different polarization circulate in response to P. vivax malaria.
PBMCs from P. vivax symptomatic (n = 11) and asymptomatic (n = 19) infected individuals as well as healthy immune controls (n = 24) were stained with a panel of metal-labeled antibodies and analyzed by CyTOF. Percentages of TH1-like CD4+ T cell (A), TH2-like CD4+ T cell (B), TH17-like CD4+ T cell (C), and circulating TFH cell subpopulations (I) identified by CyTOF after FlowSOM analysis. Boxes represent the 25th to 75th percentile, whiskers show the range (minimum to maximum) and lines represent the median. The relationship between CD27+CD127+ TH1-, TH2-, and TH17-like CD4+ T cells and clinical parameters was determined by Spearman’s rank correlation (D). PBMCs from P. vivax symptomatic (n = 6) and asymptomatic (n = 8) infected individuals as well as healthy immune controls (n = 6) were stained with fluorescent antibodies and analyzed by flow cytometry to assess CCR7 expression among CD27+CD127+ TH1-, TH2-, and TH17-like CD4+ T cells (E and F) and FoxP3 expression among CD27loCD25+CD127lo TH2-like CD4+ T cells (G and H). Representative contour plots are shown. Boxes represent the 25th–75th percentile, whiskers show the range (minimum to maximum), and lines represent the median. *P < 0.05, **P < 0.01, ***P < 0.001, ****P < 0.0001. Significance was determined by 1-way ANOVA with Holm-Sidak posttest or Kruskal-Wallis with Dunn’s multiple-comparison test (A–C, F, H, and I) or Spearman’s rank correlation (D).

