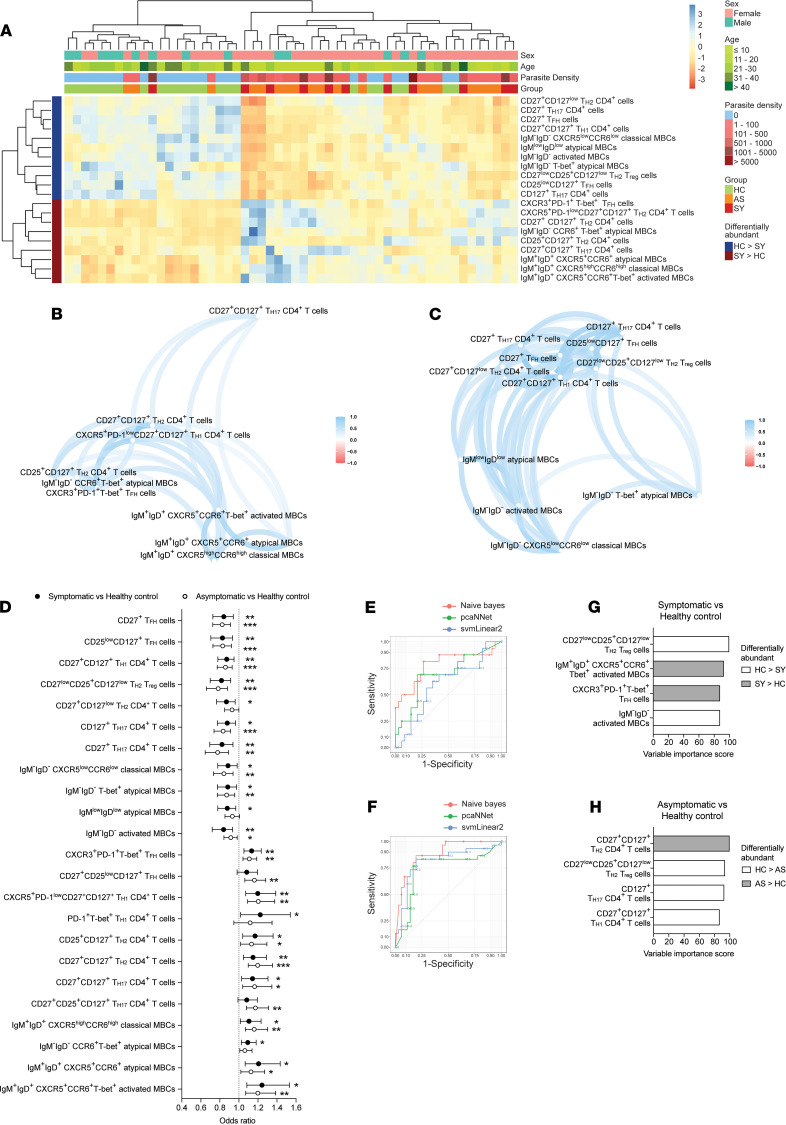
Figure 6. Memory CD4+ T cell population from diverse lineages and class-switched MBCs predict reduced risk of P. vivax malaria.
PBMCs from P. vivax symptomatic (n = 11) and asymptomatic (n = 19) infected individuals as well as healthy immune controls (n = 24) were stained with a panel of metal-labeled antibodies and analyzed by CyTOF. Unsupervised hierarchical clustering heatmap showing the frequency of cell populations that were differentially abundant between healthy immune controls and symptomatic P. vivax–infected individuals (A). Spearman’s correlation networks were used to examine the relationship between cell populations that were either reduced (B) or increased (C) in healthy immune controls compared with individuals with a symptomatic infection. Logistic regression models were used to determine the association between cell frequencies and the risk of asymptomatic or symptomatic P. vivax infection (D). Symbols represent the odds ratio and vertical lines depict the 95% confidence interval. *P < 0.05, **P < 0.01, ***P < 0.001, ****P < 0.0001. The automated machine learning workflow SIMON was used to identify cell populations that best predict protection from both asymptomatic and symptomatic infection. Receiver operating characteristic (ROC) curves for classifying individuals with either a symptomatic (E) or asymptomatic (F) infection based on the relative frequency of each cell population. Colored curves represent the 3 best performing models. Top-ranked features (variable importance score > 85%) of symptomatic (G) and asymptomatic infection (H). Bars represent the variable importance score for each feature. HC, healthy control; AS, asymptomatic; SY, symptomatic.

