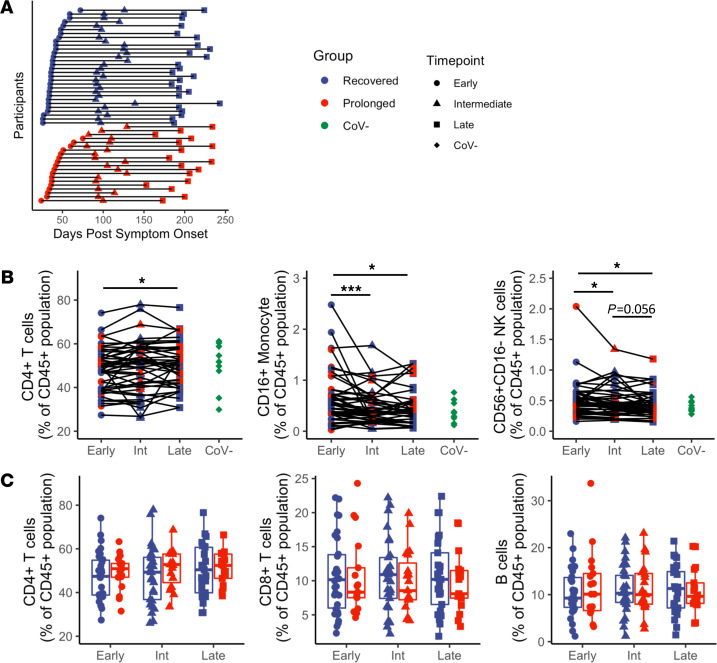
Figure 1. Immune cell subset frequencies show no difference between prolonged and recovered groups.
(A) Cohort sampling overview of all participants (n = 50) by days after symptom onset. Immune cell subset phenotyping was performed on PBMC samples for all individuals. (B) Longitudinal analysis (n = 50) reveals differences in frequencies of CD4+ T cells, CD16+ monocytes, and CD56+CD16– NK cells. (C) No differences were observed in frequencies of CD4+ T cells, CD8+ T cells, or B cells when comparing recovered (n = 30) and prolonged (n = 20) groups. Navy = recovered group, red = prolonged group, green = CoV–; circles = early, triangles = intermediate, squares = late, diamonds = CoV–. Box plots indicate median, IQR, and 95% confidence interval; significance determined by the paired Wilcoxon’s signed-rank (B) or the unpaired Wilcoxon’s rank sum tests (C) and indicated as follows: *P ≤ 0.05, **P ≤ 0.01, ***P ≤ 0.001.

