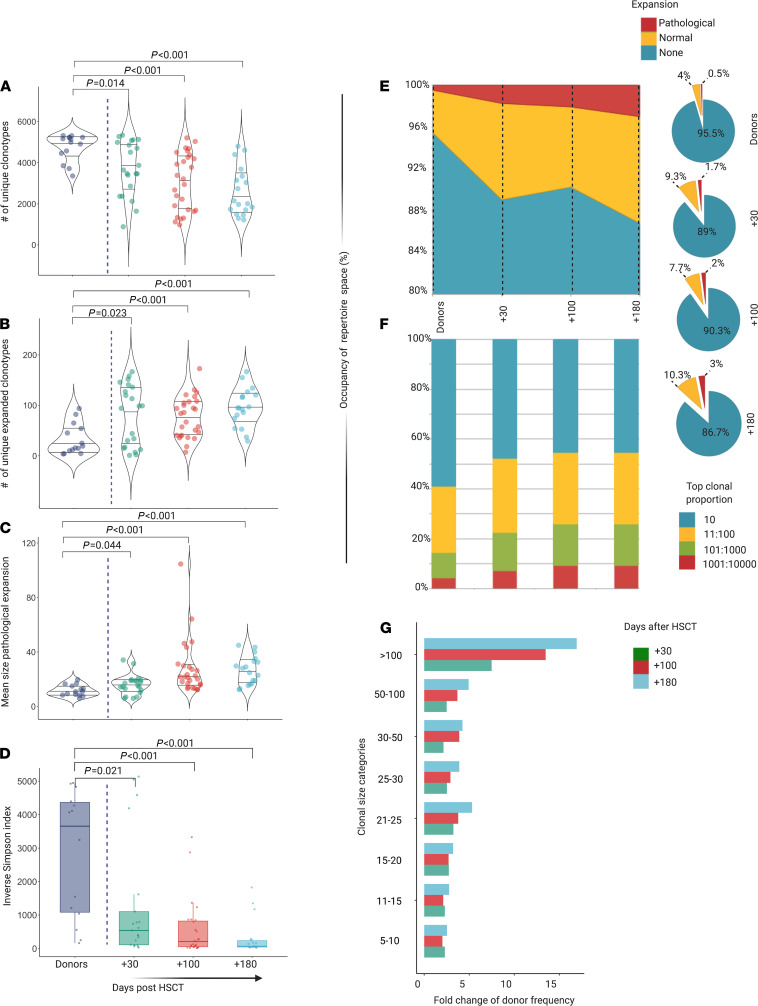
Figure 2. Diversity and structure of TCR repertoire in recipients after HCT.
(A) Number of unique clonotypes in recipients at day +30 (n = 21), +100 (n = 27), and +180 (n = 18), compared with donors (n = 14) (Supplemental Table 4B). Violin plots. One dot per sample. (B) Number of unique expanded clonotypes in recipients at day +30, +100, and +180, compared with donors (Supplemental Table 4B). Violin plots. One dot per sample. Pairwise comparisons with donor group. Wilcoxon rank sum test (P = 0.014, P < 0.001, P < 0.001, respectively). (C) Mean size of pathological expansion (indicated as mean clonotype expansion-number of template-per clonotype-per sample) +30, +100, and +180, compared with donors (Supplemental Table 4V). Violin plots. One dot per sample. Pairwise comparisons with donor group. Wilcoxon rank sum test (P = 0.044, P < 0.001, P < 0.001, respectively). (D) ISI distribution in recipients at day +30, +100, and +180, compared with donors (Supplemental Table 4B). Box plots. One dot per sample. Pairwise comparisons with donor group. Wilcoxon rank sum test (P = 0.021, P < 0.001, P < 0.001, respectively). Purple, donors; green, day +30; red, day +100; light blue, day +180. (E) Distribution of the proportions of nonexpanded, normally expanded, and pathologically expanded specificities (filled area chart and pie charts, Supplemental Table 4D). (F) Distribution of clonal proportions. The bar graph depicts the distributions of the most expanded (top 10) to less expanded clonotypes (top 1001:10000). (G) Average number per sample of pathologically expanded clonotypes according to clonal size category in day +10 (green), +100 (red), and +180 (light blue), expressed as fold change compared with donor group (Supplemental Table 4C).

