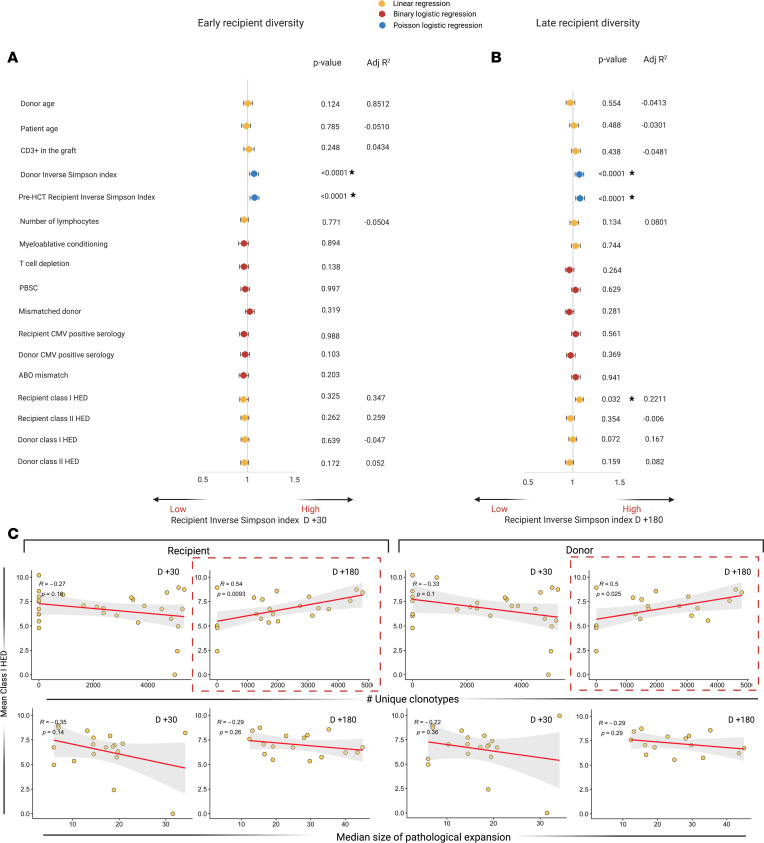
Figure 3. Factors influencing early and late posttransplant TCR diversity.
(A) Univariable analysis of factors influencing early repertoire diversity. Forest plot indicating the odds ratio and the 95% CIs of the impact of several continuous or binary predictors on diversity (ISI day +30, considered as continuous variable). Univariable models are built either as a linear regression or logistic regression (binomial or Poisson regression as per legend). (B) Univariable analysis of factors influencing late repertoire diversity (ISI at day +180, modeling as in A). (C) Linear regressions showing the correlations between recipient (left panels) and donor (right panels) mean class I HED and diversity parameters: x axes represent the number of unique clonotypes (upper panels), and median size of pathological expansion (indicating the median number of templates per pathologically expanded clonotypes, lower panels).

