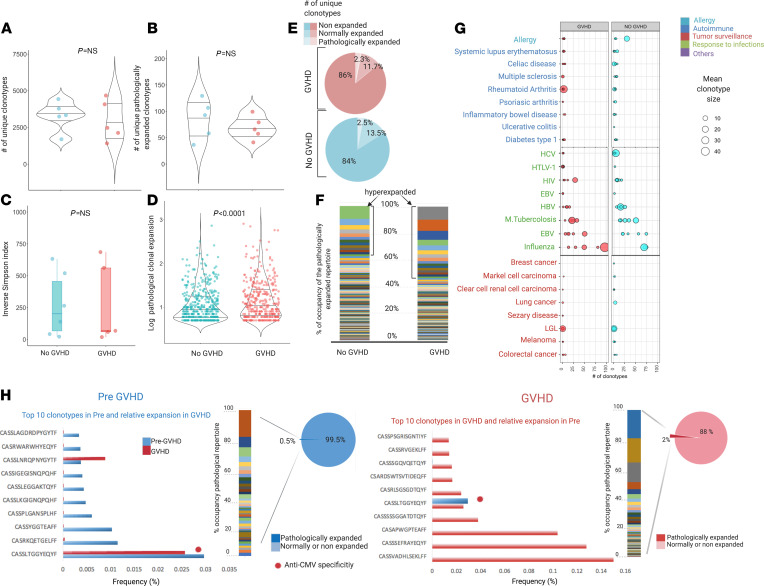
Figure 5. Structure of TCR repertoire at acute GVHD onset.
(A) Number of unique clonotypes at onset of acute GVHD (n = 5, red) and matched patients never developing a GVHD (n = 5). Violin plot. One dot per sample. Wilcoxon rank sum test (P = 0.814). (B) Number of unique pathologically expanded clonotypes in GVHD and non-GVHD groups. Violin plot. One dot per sample. Wilcoxon rank sum test (P = 0.690). (C) ISI distribution in GVHD and non-GVHD groups. Box plots depicting median and IQR. One dot per sample. Wilcoxon rank sum test (P = 0.792). (D) Size of pathologically expanded clonotypes in GVHD and non-GVHD groups. Violin plot: y axis expressed in log10 scale. One dot per clonotype. Wilcoxon rank sum test (P = 0.00096). (E) Proportion of nonexpanded, normally expanded, and pathologically expanded specificities. (F) Structural organization of the pathologically expanded portion of the repertoire. Bar plot representing each unique clonotype (each color) with its clonal size (area occupied by each color); y axis: proportion of occupancy of the pathologically expanded clonal space. The hyperexpanded group belong to all the clonotypes of size larger than 100. (G) Bubble chart illustrating the number (x axis) and mean size of expansion (bubble size) of clonotypes with known specificities in GVHD (red) and non-GVHD (light blue) groups (Supplemental Table 6A for rearrangement and annotation details). Of note, a selection of most represented disease-pathogen associated groups is captured. (H) Longitudinal analysis of 1 index case (CCF43) with clonotype analysis of pre-GVHD (day +30) and GVHD sample (day +90). Multicolor bars indicate proportion of occupancy of pathological clonal space for each unique clonotype (each color) and respective clonal size (bar area). Note: To capture all specificities in samples in the study analysis, in H the analysis was performed on the nondownsampled data set, with specificity frequency calculated as (# templates of each unique clonotype [clonal size]/total depth [total # templates]) × 100. Total depth: 24339 pre-GVHD, 70832 GVHD (Supplemental Table 6C).

