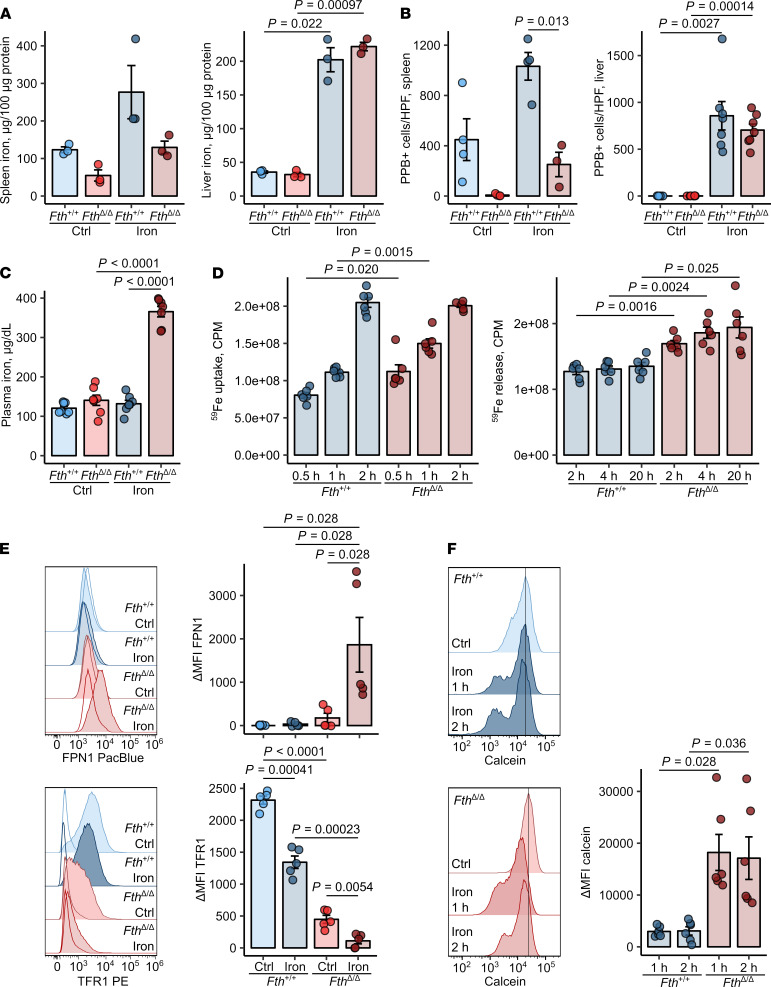
Figure 1. Fth deletion in myeloid cells increases cellular labile iron pool and iron turnover in macrophages.
(A–C) Fthfl/fl (Fth+/+) and LysM-Cre Fthfl/fl (FthΔ/Δ) mice were injected i.v. with iron isomaltoside (2 mg elementary Fe/mouse) or left untreated and analyzed 3 days later. (A) Nonheme iron content of the spleen and liver (n = 3 per group). (B) Counts of splenic and hepatic PPB-positive macrophages. Each point denotes mean from at least 3 high-power fields (HPFs) per animal (spleen: Fth+/+ ctrl, Fth+/+ iron, FthΔ/Δ ctrl — n = 4, FthΔ/Δ iron —n = 3; liver: n = 7 per group). (C) Nonheme iron concentrations in serum (n = 7 per group). (D) Iron uptake and release from Fth+/+ and FthΔ/Δ bone marrow–derived macrophages (BMDMs). Iron uptake was measured in cultures stimulated with 5 μM 59Fe3+ (in form of FeCl3) for the indicated time points. Iron release from BMDMs loaded with 5 μM 59Fe3+ into culture supernatant was determined at the indicated time points (uptake and release: n = 6 per group). (E) Surface expression of FPN1 and TFR1 in Fth+/+ and FthΔ/Δ BMDMs cultivated with/without 10 μM Fe3+ (FeCl3) for 12 hours was measured by flow cytometry (n = 5 per group). (F) Calcein-stained Fth+/+ and FthΔ/Δ BMDMs were stimulated with 50 μM Fe3+ (FeCl3) for the indicated time points. Calcein fluorescence expressed as ΔMFI was determined by flow cytometry. Each point denotes single observation (A and C–F) or a mean from at least 3 HPFs per animal (B). Bars with whiskers represent mean ± SEM. Statistical significance was assessed with 2-way ANOVA (A–C and E), Kruskal-Wallis test (E, FPN1), or repeated-measures 2-way ANOVA (E, TFR1 data, and F) with Benjamini-Hochberg-corrected 2-tailed post hoc t tests (A–F) or Mann-Whitney U tests (E, FPN1). In the plots, post-hoc test P values are indicated.

