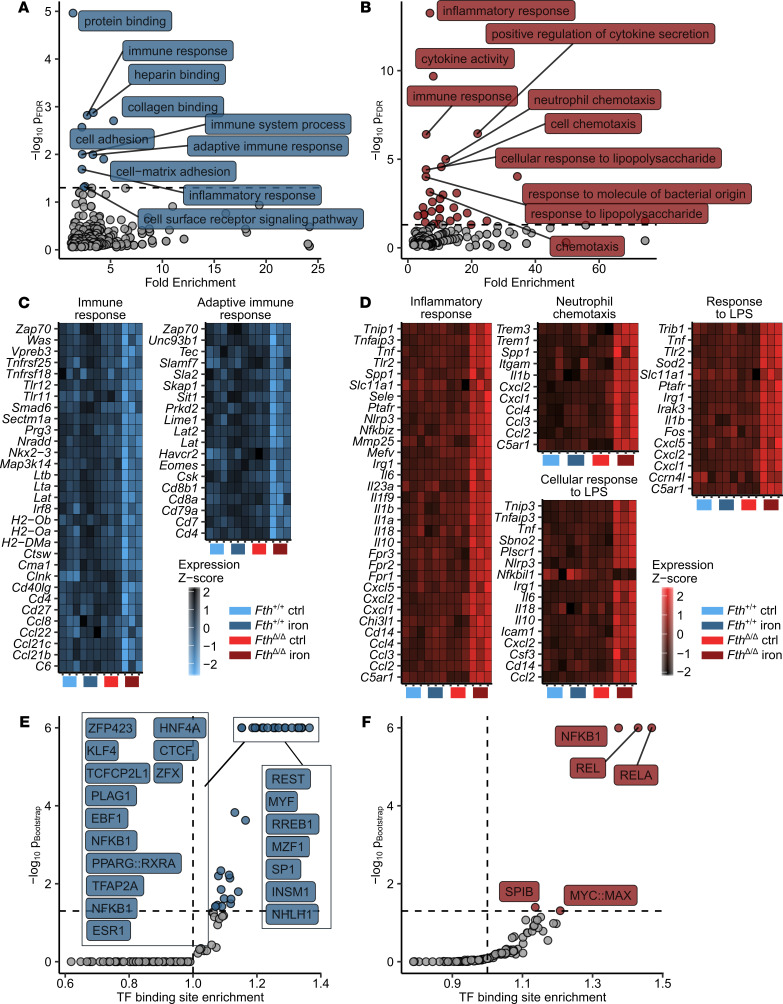
Figure 3. S. Typhimurium triggers unrestrained expression of proinflammatory NF-κB targets in iron-loaded FthΔ/Δ mice.
Fthfl/fl (Fth+/+) and LysM-Cre Fthfl/fl (FthΔ/Δ) mice were i.v. administered PBS or iron isomaltoside (2 mg elementary Fe per animal) and infected 3 days later with 500 CFU GFP-expressing S. Typhimurium (STG) (n = 3 mice per group). Twelve hours after infection, total spleen RNA was isolated and subjected to a whole transcriptome measurement with gene microarrays. Genes significantly downregulated (PANOVA iron/genotype < 0.05 and estimateiron/genotype < -1.5, n = 893 genes) and upregulated (PANOVA iron/genotype < 0.05 and estimateiron/genotype > 1.5, n = 271 genes) were identified by 2-way ANOVA and linear regression as described in Methods and Supplemental Figure 5. For a list of significant genes with ANOVA P values and regression estimates, see Supplemental Table 1. (A and B) GO term enrichment analysis for genes significantly downregulated (A) and upregulated (B) by the iron/genotype interaction. Significant GO terms are highlighted in blue and red, respectively (downregulated genes: n = 10 significant GO terms, upregulated genes: n = 31 significant GO terms), 10 most significantly enriched GO terms are labeled with their names. For full results of GO term enrichment analysis, see Supplemental Tables 2 and 3. (C and D) Heatmap representation of normalized gene expression values (z score) for genes assigned to selected significantly enriched GO terms. (C) Significantly downregulated genes.(D) Significantly upregulated genes. Color scale corresponds to normalized expression. (E and F) Transcription factor (TF) binding site enrichment analysis for genes significantly downregulated (E) and upregulated (F) by the iron/genotype interaction. For each TF-binding motif, the Benjamini-Hochberg-corrected P value and fold enrichment are plotted. Significant TF-binding motifs are highlighted in blue and red (downregulated genes: n = 35, upregulated genes: n = 5 significant TF binding motifs), 10 most significantly enriched TF-binding motifs are labeled with their names.

