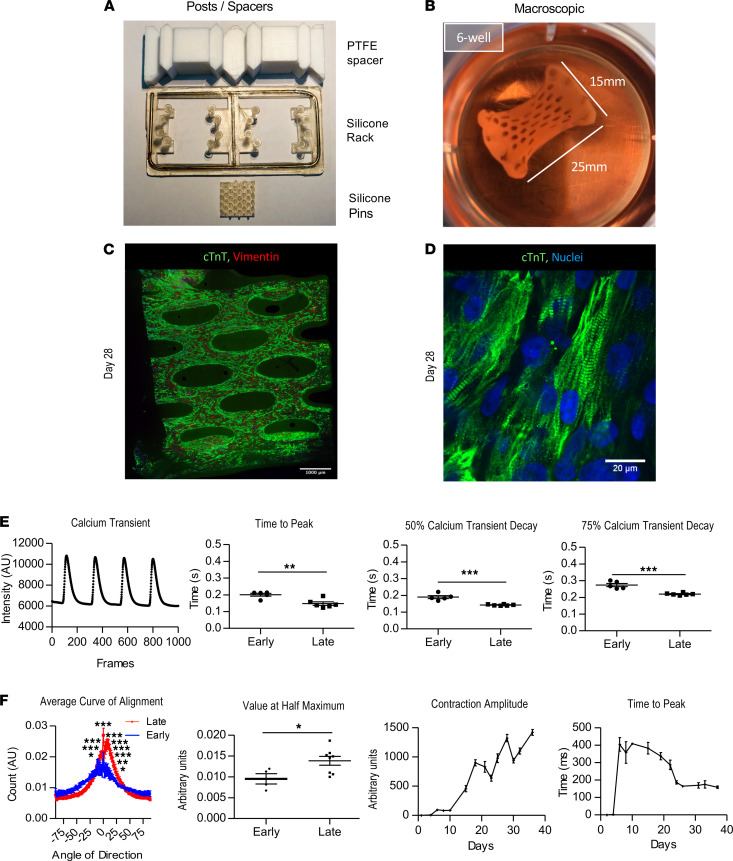
Figure 1. In vitro characterization of EHTs.
(A) Equipment used to make silicone mold and to generate EHTs. (B) Macroscopic image of EHT just prior to grafting. (C) Immunostained EHT (troponin T abbreviated as TNNT2; fibroblasts; vimentin) 28 days after generation. Scale bar: 1000 μm. (D) Higher magnification image of C (TNNT2, fibroblasts, vimentin). Scale bar: 20 μm. (E) Graph of late EHT calcium transient (paced 1 Hz) and calcium transient differences between early and late EHTs (early, <2 weeks; late, >4 weeks). (F) Troponin T cell alignment data (n = 4 early; n = 8 late) and contraction kinetics over time (n = 6). Data are presented as mean ± SEM, and 2-way ANOVA and unpaired Student’s t test were the statistical methods used. *P < 0.05, **P < 0.01, and ***P < 0.001.

