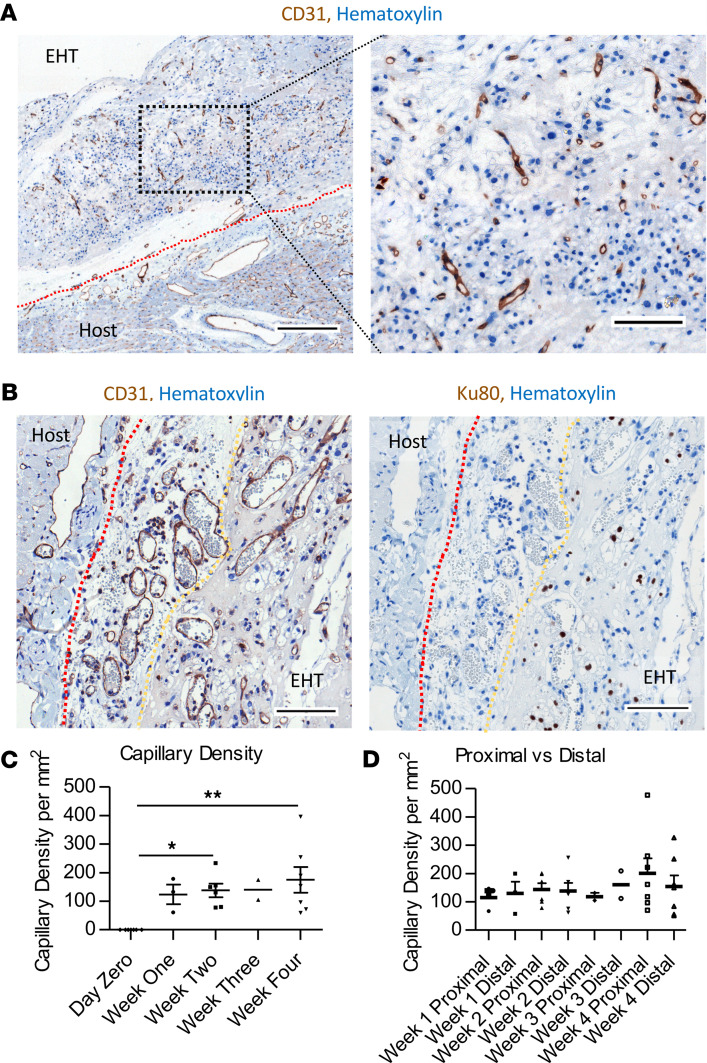
Figure 3. EHTs are vascularized by the host.
(A) CD31 staining of EHT/host with higher magnification image (right panel); scale bar left panel: 300 μm; right panel: 100 μm. (B) CD31 (left panel) vessels and Ku80 nuclei stain of serial section; scale bar: 100 μm; red dotted line shows the heart; yellow dotted line shows the EHT border. (C) Graph of EHT capillary density over time. (D) Bar chart of capillary density of proximal and distal parts of EHT at serial time points (week 1 n = 3, week 2 n = 6, week 3 n = 2, and week 4 n = 7). Data presented as mean ± SEM and 1-way ANOVA used to compare groups. *P < 0.05, **P < 0.01.

